AI is a game of kings, and OpenAI knows it
Amazon's (NASDAQ:AMZN) second quarter profits, released at the end of July, were at record high levels.
That's not an accident of course. Consumers who've been stuck at home, or are now warily going back to offices amid ongoing spikes of the coronavirus, have opted to shop online rather than return to bricks-and-mortar stores—if in fact, those establishments are even open.
And based on the soaring valuations of a variety of technology shares, investors are betting most people will be stuck close to home for quite some time to come. The current and projected market caps of some of the US's largest tech companies, whose output enables work, entertainment and yes, shopping, from home—including Microsoft (NASDAQ:MSFT), Apple (NASDAQ:AAPL), Netflix (NASDAQ:NFLX) and Amazon—have swollen to bubble-era extremes at the same time the worst pandemic in 100 years rages.
The value of companies listed on the NASDAQ has expanded by $2.9 trillion in this of all years, suggesting investors expect social distancing to become more permanent, making tech solutions for everything including shopping a higher priority in the new, touchless world.

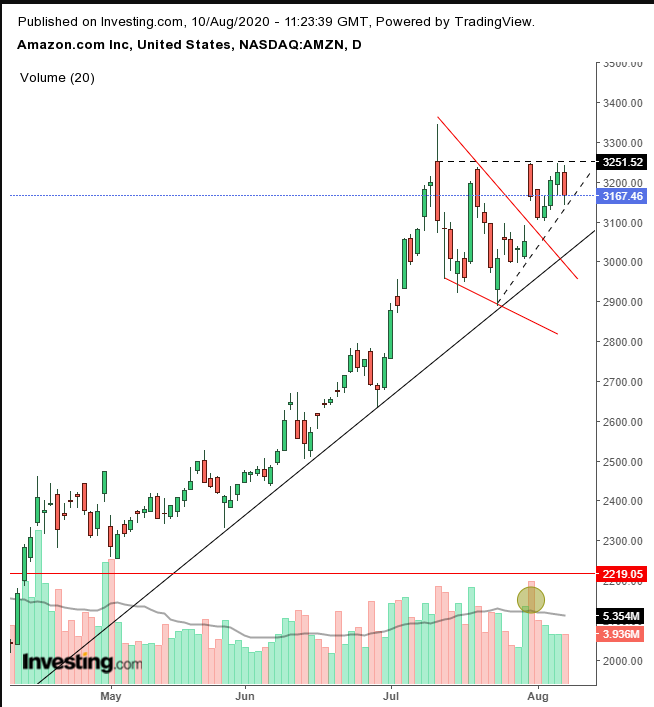
Shares of the Seattle-based e-tailer may have completed a falling flag, bullish as they bounced off its uptrend line since the March bottom. Notice, however, that the price may, in fact, be forming an ascending triangle that has yet to provide an upside breakout (dotted line).
Volume suggests that the flag scenario is correct, as the earlier upside breakout coincided with the highest volume spike since May. However, since then, volume has fizzed.
Still, we’re bullish on the stock, but that doesn’t mean a broad market selloff—if and when that occurs—won’t drag Amazon down with it.
Trading Strategies
Conservative traders would wait for an upside breakout of the ascending triangle, whose penetration would surpass the July 13 all-time high. That would include a 3% penetration, preferably on a closing basis, to filter out a bull trap. They would also wait for 3 days in which the price remains above the pattern, adding a time filter to price depth. Additionally, they would wait for a return move back to the pattern.
Moderate traders would also wait for a completion of the ascending triangle, but they’d be content with a 2% penetration and a 2-day filter. They, too, could wait for a pullback, for a better entry, if not for proof of trend.
Aggressive traders might rely on the flag breakout. They may wait for the triangle breakout or a return move to the flag, for a better entry.
Trade Sample
Entry: $3,100
Stop-Loss: $3,000
Risk: $100
Target: $3,400
Reward: $300
Risk:Reward Ratio: 1:3
Which stocks should you consider in your very next trade?
The best opportunities often hide in plain sight—buried among thousands of stocks you'd never have time to research individually.
That's why smart investors use our Stock Screener with 50+ predefined screens and 160+ customizable filters to surface hidden gems instantly.
For example, the Piotroski's Picks method averages 23% annual returns by focusing on financial strength, and you can get it as a standalone screen. Momentum Masters catches stocks gaining serious traction, while Blue-Chip Bargains finds undervalued giants.
With screens for dividends, growth, value, and more, you'll discover opportunities others miss. Our current favorite screen is Under $10/share, which is great for discovering stocks trading under $10 with recent price momentum showing some very impressive returns!
