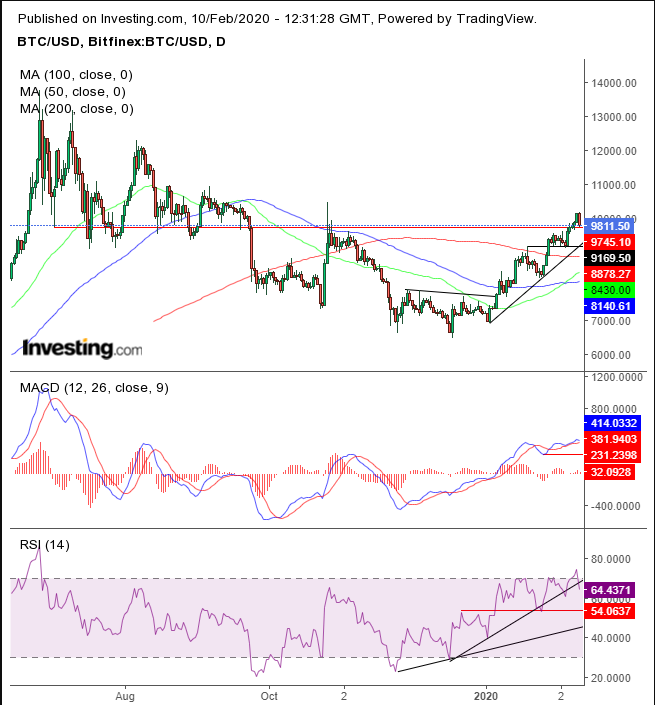
Bitcoin has plunged around 3.75% today, taking the cryptocurrency back below the critical $10,000 level. This selloff comes after a straight five-day rally of over 10%.
Despite the numerous reports currently circulating about a potential digital currency launch by the Fed and the ongoing interest in Facebook's (NASDAQ:FB) much-debated digital money initiative, Libra, the story dominating the headlines today is the growing impact of the continued spread of the deadly coronavirus.
Of course, the Fed may or may not consider creating a U.S. digital currency. And Mastercard (NYSE:MA), a founding member of the Libra Association, which had been toying with the idea of using Facebook's crypto initiative as its digital currency, has decided against it due to transparency concerns.
But these reports have been going back and forth for a while, yet hadn't impeded the 10% rise of the past five days. So the driver of today's slump is either still unknown or simply profit-taking at a time when other haven assets are fluctuating.
When so much is unclear around the fundamental drivers of an asset, technical analysis of the charts can add a bit more clarity.
The December-January H&S bottom’s target was more than realized during the rally. The digital currency reached a round number whose psychological significance has left an impression, in the form of an obvious support-resistance level, starting with the July 2 low. Later, after falling through it in September, the price turned to a resistance in October and November.
Both the MACD and the RSI demonstrate a setup for at least a corrective pullback. The MACD has attempted a third rise, which, if it fails and falls below the late-January high, would be an obvious sell signal. The RSI has already provided such a call, when dipping below its recent uptrend line since mid-December, from a 75 level, the most oversold since June, to boot. A fall below 54 would constitute a momentum top.
The minimum expectation is a return to retest the uptrend line since the beginning of the year. Note that as of this position, such a meeting would coincide with the price level that was a support through the end of December and beginning of January, after already acting as a resistance in mid-December. There is a lot of vested interest at the $9000 levels.
Trading Strategies
Conservative traders would wait for a return to the uptrend line and seek evidence for demand.
Moderate traders may wait for a pullback to buy at a better price, not waiting for a rebound that would evidence support.
Aggressive traders may short the expected pullback.
Trade Sample - Short Position
