The IMF predicts the coronavirus pandemic will force US growth to shrink to -8.0% in 2020, while the Canadian economy will contract even further, to -8.4%. Both have challenges ahead of them, but the Canadian dollar is on the rise while the US dollar has recently been struggling.
Of course, there is one glaring difference between the two North American economies: COVID-19. Another theme that might be boosting the Loonie is rising oil prices.
While yesterday Canada had 288 new coronavirus cases, continuing to flatten the curve, US is still knee-deep in the first wave of the pandemic. Perhaps the next headline tells the whole story: “Poll finds 81% of Canadians think Canada-U.S. border should stay closed."
While Canada’s lockdown worked, America’s top authority on infections diseases, Dr Anthony Fauci, says the pandemic “never got down to where we wanted to go," as the US death rate surpassed 130,000, following the rapid lifting of lockdown restrictions around the United States.
The second potential boost to the Canadian currency is the climb in the price of oil from the unprecedented -$40 a barrel back in late April, to the current +$40, a 4-month high. As one of the world's largest producers, higher crude prices are a plus for the Canadian economy.
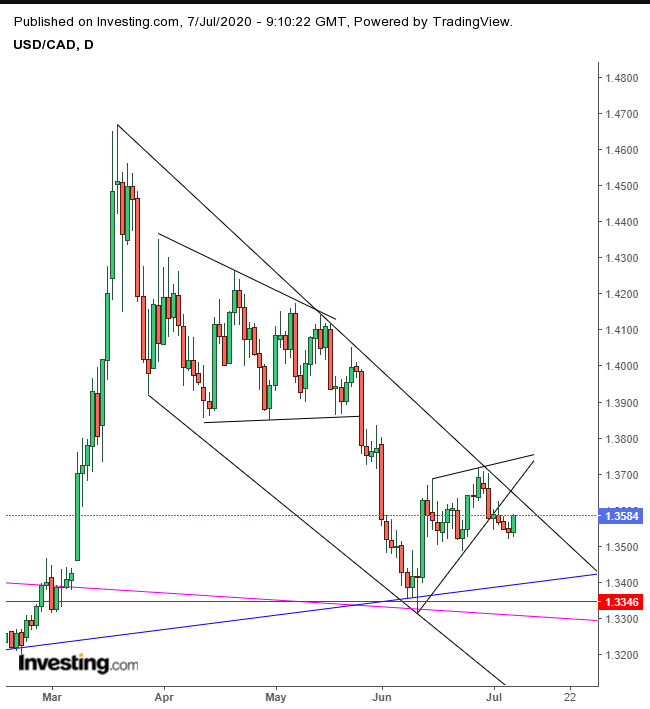
Perhaps these two issues are boosting the Loonie, at the dollar's expense. Trading patterns of the USD/CAD suggest a repeat of the 5% plunge seen in May-June.

Although the dollar is strengthening today, the USD/CAD had already completed a rising flag when it broke to the downside last week. This is a continuation pattern—when a changing of the guard takes place and the underlying downtrend resumes. We can see that the pattern even respected the downtrend line that had been in place since the March high. The bottom of the flag also establishes a falling channel—a well defined trading area that includes the primary trend and intermittent corrections.
We also noticed that the bottom of the flag was the focal point of three trendlines: (1) the falling trendline (pink) that has been in place since December—previously this had served as resistance and is now a presumed level of support; (2) a horizontal trend line that offered resistance to the price from August through to this February and, finally, (3) the long-term uptrend line since the September 2017 bottom, is still intact.
This confluence of support levels required bears to make a show of force. Short traders, who fear losing profits—or, tired bears—took profits. Exiting a short includes a buy, which increases demand and accounts for the rise in the bearish flag. Traders that missed the prior move vow to be on the alert for another opportunity and then pick up all those discarded shorts, forcing a downside breakout of the rising flag.
These bears are much hungrier than the lucky early ones. Also, after a rest, old bears may feel invigorated and work up a new appetite once they see newer bears consuming profits. When the downside breakout occurs, those who liquidated are lured back in for a second helping.
That force allows bears to overcome whatever bulls might be attached to from among the the myriad of support levels described above.
That is the dynamic that could drive a repeat of the intensity of the previous drop in the USD/CAD.
Trading Strategies
Conservative traders would wait for the price to fall below 1.3300 to clear the three trend lines.
Moderate traders may be content with a close below 1.3484, the June 23 low.
Aggressive traders may short at will, providing they can muster a stop-loss to withstand the volatility that follows a breakout, or the loss of the position.
Trade Sample – Aggressive Short
- Entry: 1.36
- Stop-Loss: 1.3650 – channel top
- Risk: 50 pips
- Target: 1.3350 – above the June 10 low
- Reward: 250 pips
- Risk-Reward Ratio: 1:5
Note: This is just a sample to provide a picture of a coherent trade plan. Not every trade can win. Not every trade is suitable for every traders. Use the components of this plan to personalize one for your budget and temperament.
