At time of writing, European stocks were tracking US shares higher, after yesterday's Wall Street session showed the reflation trade is alive and well and all four major indices rallied.
What seems to have been overlooked in all the bull market rumpus are value stocks—companies whose profits suffered during lockdowns brought on by the COVID-19 pandemic, when growth stocks in the tech and communications sectors in particular outperformed. The recent narrative indicated that now, with economic growth back on track, value shares would begin to move higher.
Indeed, Bloomberg, as of yesterday, forecast sector revenue growth for 2021 going forward. In their model (visible here) value stocks are anticipated to increase revenues in Q1 by as much as one-third, while growth stocks' revenue is forecast to fall by one fifth YoY.
Boosting that outlook are strong earnings results from Europe, most recently from Swiss food and beverage giant Nestle (SIX:NESN), which said, "organic sales should grow more than expected this year" citing strong growth in Q1 for its coffee and dairy products divisions. The increase was sparked by additional delivery services to consumers stuck at home during pandemic lockdowns as well as restaurants stocking up in preparation of reopening as lockdown restrictions begin to lift across the US and parts of Europe.
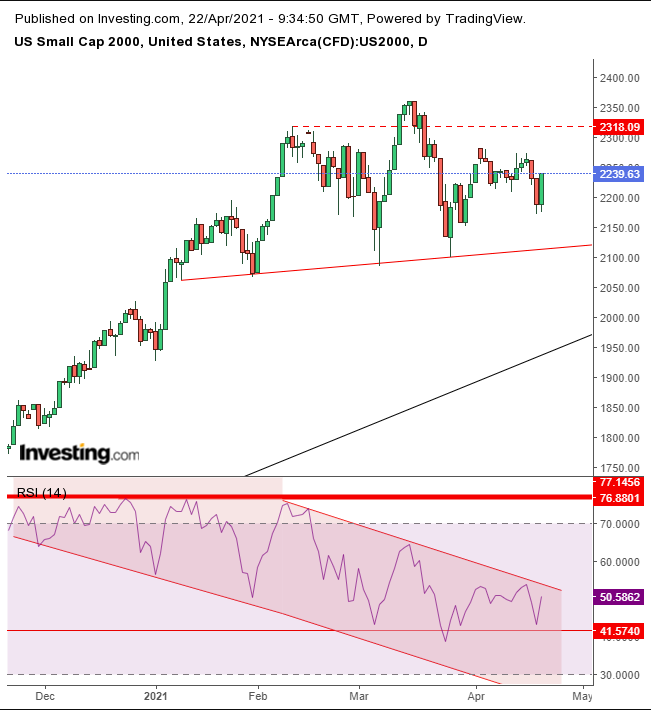
That would mean the outlook for a broader array of small and domestic businesses listed on the Russell 2000 should be rosier as they benefit from the reflation trade. In fact, analysts believe this earnings season may be the catalyst for the small cap index to fly. But the technicals for the Russell are the weakest among the major US benchmarks. The small cap index has been moving sideways even as peer indices—the Dow, S&P and NASDAQ—have been posting record after record.

Small caps are forming a H&S top, complete with a downside breakout of the neckline, connecting the range’s lows.
Meanwhile, the RSI, which measures momentum, has been providing a potent negative divergence, first when momentum hit a ceiling, while prices kept climbing from November, then, when the RSI fell outright, against the advance in prices between February and March, for both highs and lows.
The RSI continues to struggle, now between November support and its falling channel. If it breaks the support, it would be another signal that investors are cashing out of small caps.
Remember, though, the price will be complete, only upon a decisive breakout, which should also include the converging uptrend line.
Trading Strategies
Conservative traders should wait for the price to fall below the pattern neckline and the uptrend since the 2020 bottom.
Moderate traders would short upon the completion of the H&S, even without the price’s decline below the uptrend line.
Aggressive traders could short at will, provided they accept the higher risk that corresponds to the higher reward of beating the market in case the pattern never completes. Higher risk means a higher need for a careful trade plan. If you don’t know how to draw one up, here’s a basic example:
Trade Sample
- Entry: 2,250
- Stop-Loss: 2,300
- Risk: 50 points
- Target: 2,000
- Reward: 250 points
- Risk:Reward Ratio: 1:5
Author's Note: We can’t predict the future. We can provide our interpretation of the balance of supply and demand and likely statistical outcomes. Even if we’re right, this is just a sample. There are different ways to approach this trade, and you need to know how to customize a trade plan according to your timing, budget and temperament. Till you learn how to do that, you can follow our guidance, for the purpose of learning, not profit, or you’ll end up with neither.
