Will gold get back to $2,000 an ounce this week? And, if it does, could it stay there?
Two sets of U.S. jobs data due this week might help determine what's next for the yellow metal. The first is weekly jobless claims scheduled for Thursday, while the second is nonfarm payrolls numbers for August due Friday.

Weekly jobless claims are forecast to come in at 980,000 versus last week’s 1.006 million. Nonfarm payrolls are projected to have grown by 1.4 million jobs, after a 1.76-million addition in July. Should either, particularly the monthly jobs number, come in weaker than expected, then gold could take off. Conversely, an upbeat performance by the data could pose headwinds for the yellow metal.
Fed Speak Could Lend Direction
Investors will also get the chance to hear from three senior Fed officials as they digest last week’s announcement of the Central Bank’s new strategy that will keep interest rates near zero, even if inflation rises above its target, in order to bolster the recovery in the economy and the labor market.
Vice Chair Richard Clarida is to give a speech on the Fed’s new monetary policy framework on Monday. Governor Lael Brainard is also set to deliver remarks on the new policy framework a day later, while New York Fed President John Williams is due to discuss the economy and the pandemic on Wednesday.
The speeches will be the last before the Fed enters its typical blackout period ahead its next policy meeting, scheduled for Sept. 15-16.
While the jobs numbers and comments from senior Fed officials could greatly impact gold’s direction, there are chart elements that may also influence the yellow metal’s push-and-pull this week.
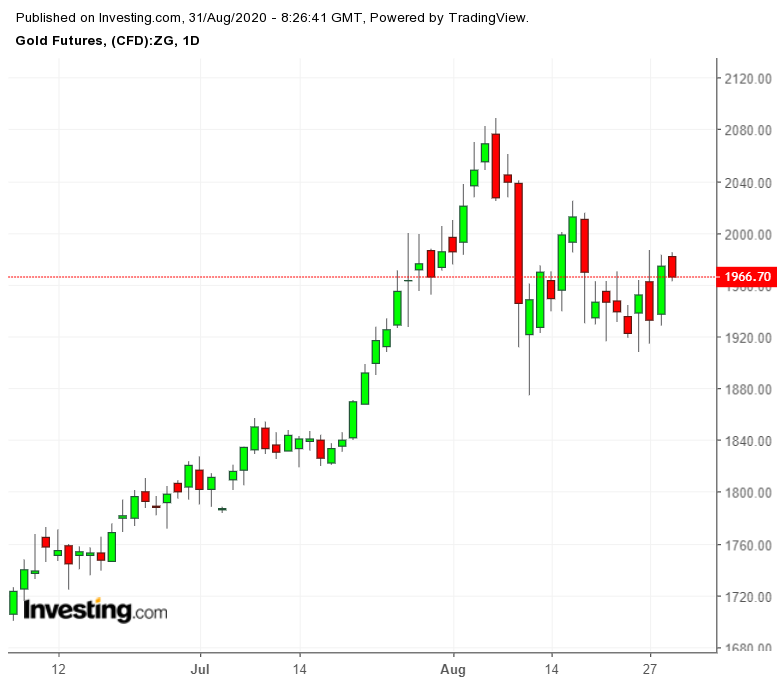
As trading for end-August and the first week of September began Monday, gold opened higher in Asia, reaching just $15 short of $2,000, before turning down further.
Charts Strength Evident in Gold
While at a glance, the uptrend appeared to be a continuation of the volatility that has caused the gold price to swing $50 or more per day at times, charts also indicated tangible support for the higher levels after both the spot price and benchmark futures contracts showed an ability to pass key resistance since Friday.
“The first hurdle to overcome is 2015 followed by the high at 2075,” precious metals strategist Paul Robinson said in a post on Daily FX.
“This may take a bit of time, so patience may be required before the momentum crowd is drawn back in.”
On the lower end, Robinson said it was imperative that the spot price did not lose its $1,902 support — or the bottom struck on Aug. 11. That would be a $70 drop from current levels and not looking likely imminently — though with the vagaries in gold this month, one can never tell.
He added:
“After spiraling into a top earlier this month, gold has become tamer as it digests the surge from March. Currently, there is good support to lean on via the 2011 high and the trend-line from March. This confluent intersection support from varying angles makes for a nice line-in-the-sand.”
The so-called confluent intersection shows that gold may experience some more chopping around before it tries to run above the $1,985 level, although this isn’t a bad thing as every dip draws a fresh round of buying. Robinson goes on:
“The back-and-forth we have seen since the high is forming a wedge pattern that suggests we may indeed see another run develop sooner rather than later.
In sum, gold is sitting on good support and it appears to be an attractive spot from a risk/reward perspective for would-be longs. A break below though could get things rolling downhill a bit, giving short-term shorts the upper hand.”
Dollar Facing 'Uphill Battle'
While gold was showing technical strength, its nemesis, the dollar, has considerably weakened since last week, investment firm Pimco pointed out.
The Dollar Index, which pits the greenback against six major currencies, is facing an "uphill battle" to find support as the Fed’s new emphasis on averaging higher inflation over a longer period suggests an accommodative monetary policy that could only depress yields. Pimco said in a statement:
"We believe an unprecedented degree of fiscal support, the Fed's expected commitment to make up for past inflation target overshoots, and the US' uneven recovery are likely to impart a depreciation bias to the dollar in all but the most extreme cyclical scenarios."
Notwithstanding the impact of a vaccine delivery for the coronavirus, the dollar could also weaken against competitive currencies such as the Aussie, Loonie, Norwegian krona, Chinese yuan, and Korean won, it said.
Oil Gets Slight Boost
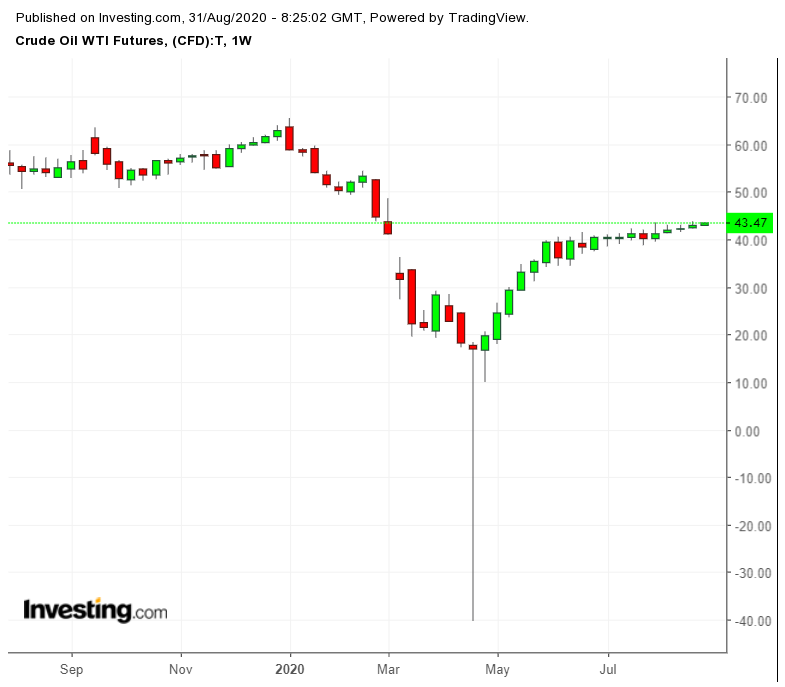
In oil’s case, crude prices edged higher Monday in cautious trade as investors reassessed the market after last week’s Hurricane Laura largely spared the U.S. energy industry from disaster.

Goldman Sachs said in a note that it had upped its third quarter 2021 forecast for Brent crude by $5 a barrel to $65. It said:
“While current lackluster fundamentals (or a cross-asset risk-off event) could still lead to a short-term spot sell-off, we find a compelling risk-reward for going long deferred Brent prices, and recommend a long Dec-21 Brent position.”
