While it’s been a very unhappy new year for many commodities—with crude oil plunging and copper following suit—it's been a rosy start for gold. Which, after so long makes a nice change, to be writing something positive about the precious metal, even though we may only be witnessing a knee-jerk reaction, as money flows into a safe haven asset class as equity markets continue to fall.
However, while the current rally is welcome, and certainly long overdue, there are nevertheless some worrying aspects which would suggest the price action of the last few days may simply be a short-term move, and not suggestive of a longer-term reversal. In addition, it is also interesting to note the reaction of silver, which has remained moribund throughout the current China and North Korea turmoil.
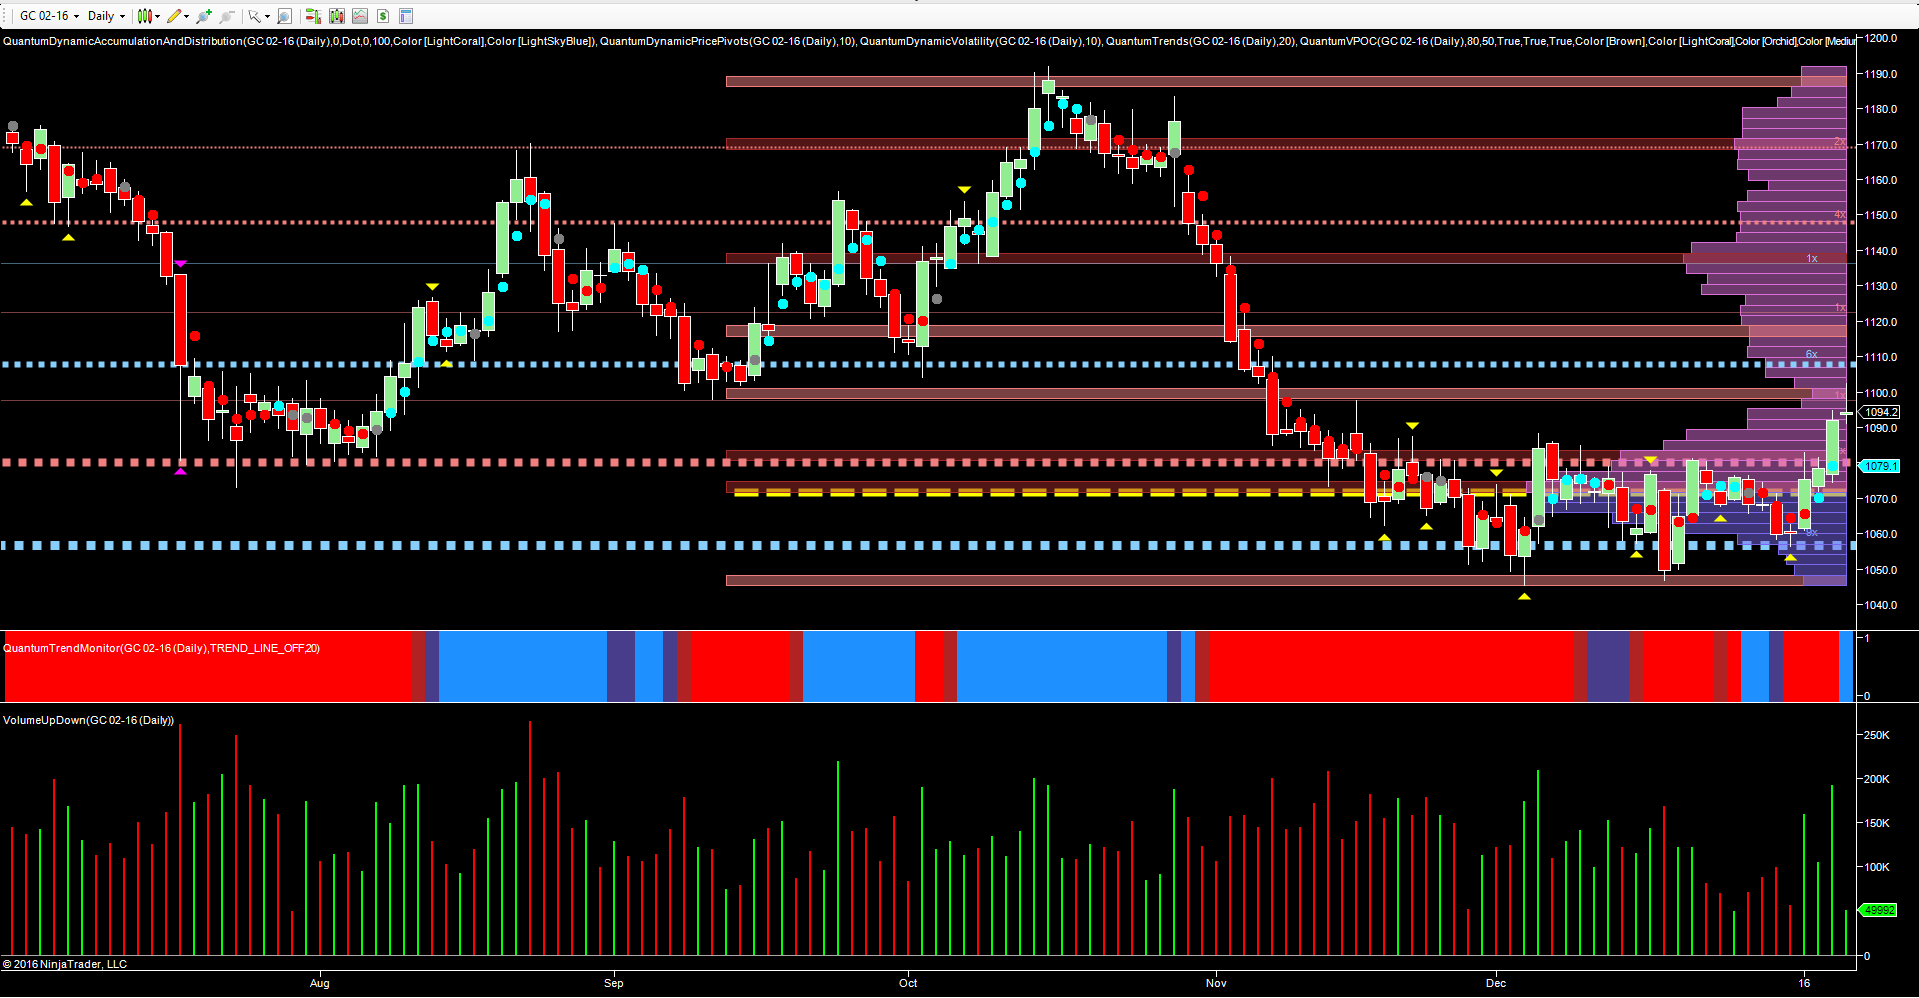
If we start with the technical picture for gold on the daily chart, December was a time of consolidation, with the metal building a platform of support in the $1050 per ounce area, with accumulation developing in the $1055 per ounce region, and a simultaneous ceiling of resistance in the $1080 per ounce zone. Both of these were signaled on the accumulation and distribution indicator, with the red dotted line indicating the ceiling and the blue dotted line the floor of support.
Yesterday’s wide spread up candle duly took out the ceiling, but it is interesting to note the associated volume which was high, suggesting price action should have been more dramatic. Furthermore, the volume point of control duly transitioned to the $1070 per ounce region, as transacted volumes are now building in this area with further consolidation now likely.
As for the overnight trading session, with Chinese markets having been suspended, we might have expected to see a much stronger move into gold as a result, and yet the current price action is muted to say the least, with gold currently trading off the highs of $1102.50 per ounce to trade at $1094.50 per ounce at the time of writing. Ahead lies a well developed area of resistance in the $1108 per ounce area, and this is likely to prove seminal to any further advance for gold in the short term.
Longer term, the key for any recovery in gold is likely to come from inflation, and while oil prices are not the answer, soft commodities may well produce this in abundance, particularly if the longer term weather forecasts for this year are correct, with staple food prices likely to spike higher as a result.

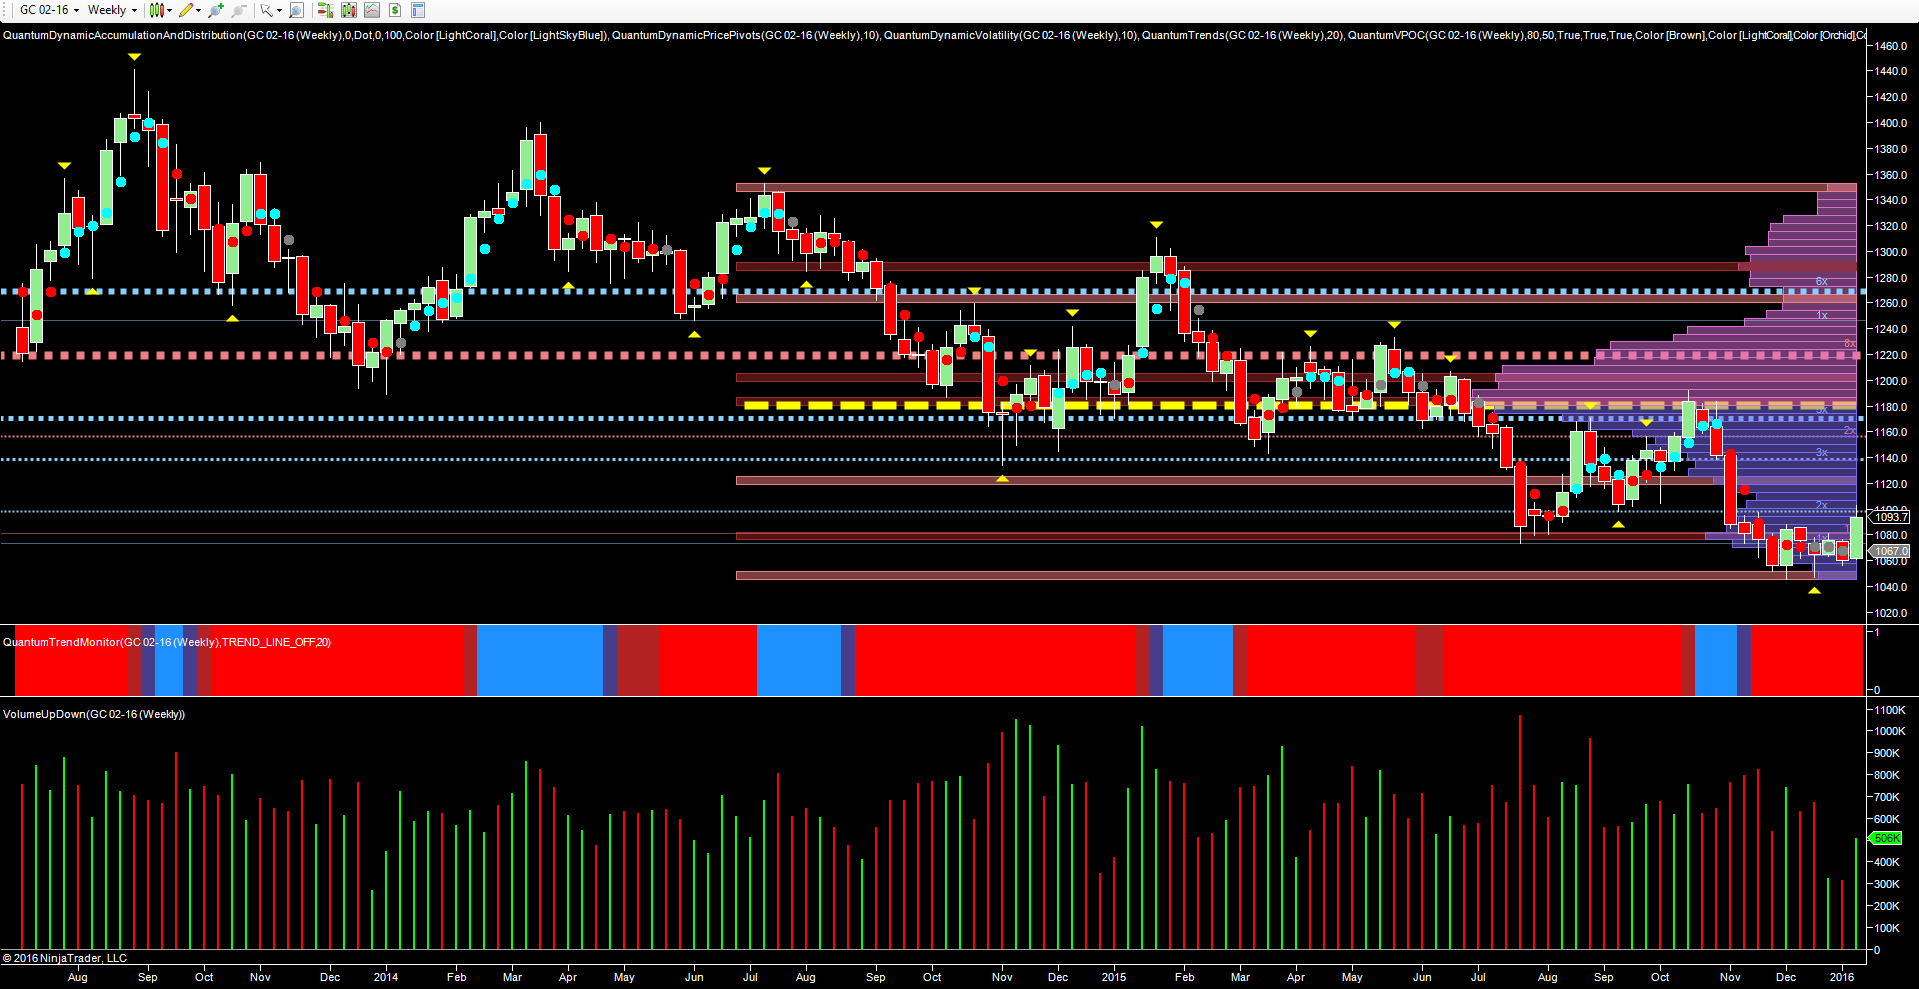
Moving to the weekly chart for gold, this reflects the longer term view, and while there has been a degree of support and buying in December, this does not suggest a developed buying climax at present. What seems increasingly likely is the current price action will ultimately be yet another short term rally in the longer term bearish trend.
For gold bugs' sake I hope this is not the case, but the technical picture would suggest otherwise. How far the current rally will run depends on the extent of the current rout in equities with Shanghai leading the way. Should $1110 per ounce be taken out, a move to $1140 per ounce is possible. What is interesting here however, will be the reaction late in the US session with buying coming to the market once the knee jerk reaction of the open has been absorbed.

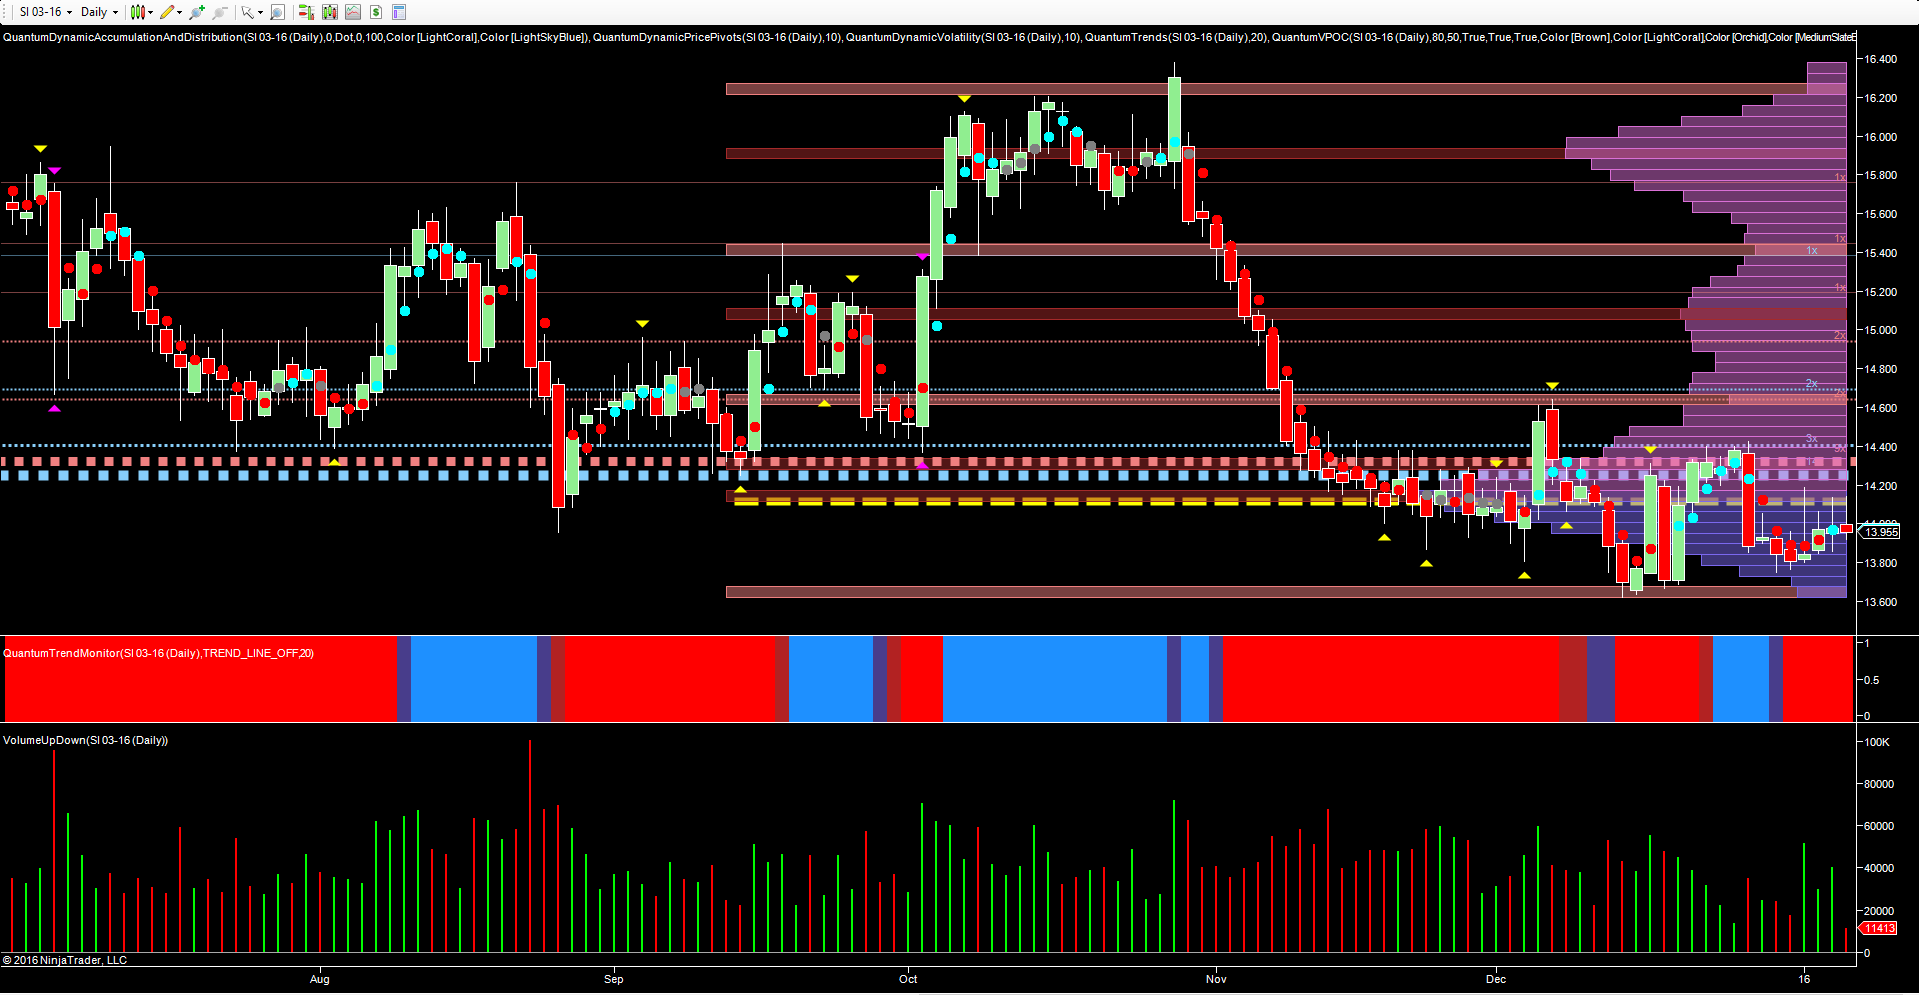
Moving to silver, which is perhaps the most interesting aspect of all, is in particular the lack of any follow-through from the precious metal to the industrial metal. Indeed, silver prices over the last three days have remained virtually unchanged, trading in a narrow range with deep wicks to the upper body, and failing to break above the volume point of control which sits in the $14.10 per ounce region.
Given the current volatility in stock markets globally—and with North Korea adding its own brand of uncertainty to the mix—one would expect silver to follow gold higher. Strange indeed that it has not and continues to look very bearish on the daily chart. Perhaps the moral of the story is this: silver could now be the barometer for gold, and if so, the signs are not encouraging for gold bugs.
Finally, the golden line in the sand for gold is $1045 per ounce, which must hold if the present rally is to develop some serious momentum, while a break on high volume would reinforce the longer-term bearish trend.
