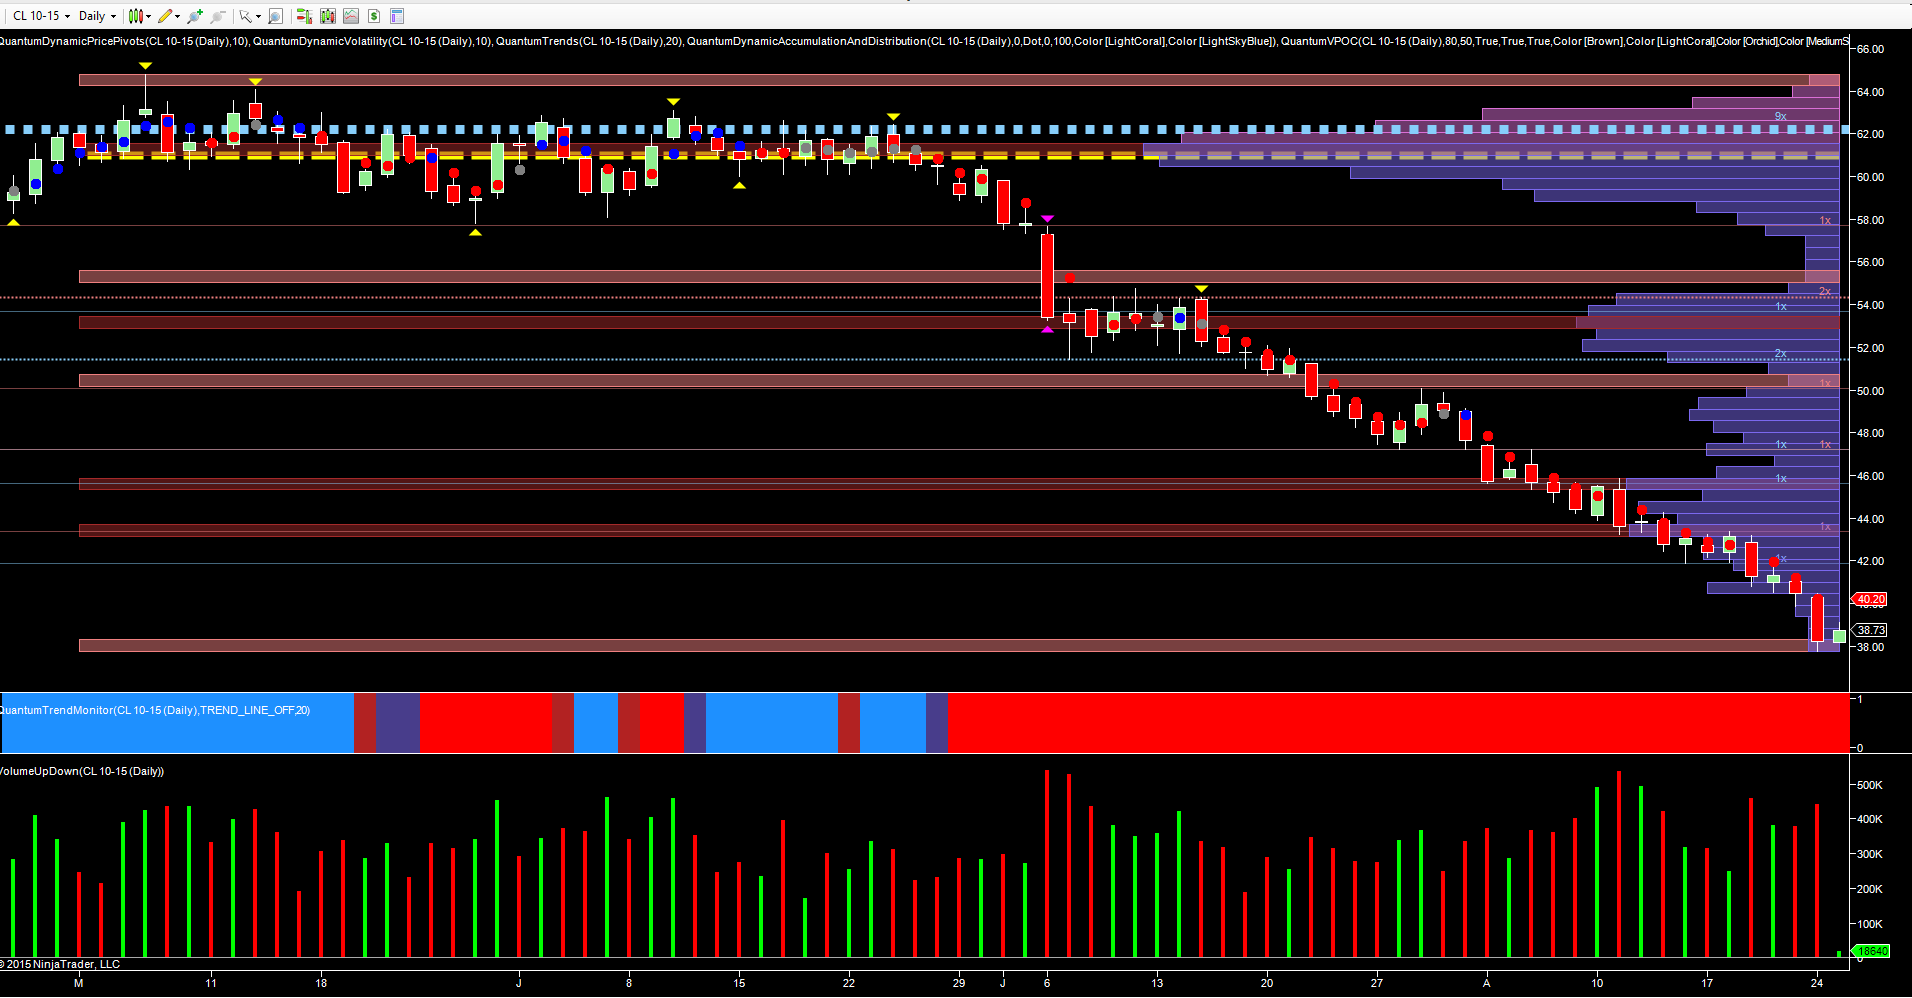
For oil traders and speculators, the summer months continue to deliver stellar trading opportunities, and whilst equity investors are wringing their hands, the WTI contract shows no signs of wanting to reverse just yet. Indeed as a trader whose primary approach is based on volume price analysis, what is abundantly clear from the daily chart for oil is that we have yet to see any sign of a buying climax which will ultimately be the precursor to a pause and reversal in due course.
In my last post on oil entitled ‘How low can oil prices go‘ I suggested we would see a test of the $40.85 per barrel level, and that if this region were breached, we could then expect to see oil prices move towards the low of $36.47 per barrel, last seen in 2003. Yesterday’s price action finally drove the market through the first of these levels, closing at $38.24 per barrel with a wide spread down candle, with the price action confirmed by high volume and the psychological $40 per barrel price point failing to offer any support whatsoever.
Furthermore, we are now testing another low volume node on the VPOC indicator in the $38 per barrel region, and given the transactional volumes at this level, we can expect to see a relatively quick move through here, and on down to test the $36 per barrel area in due course. In early trading on Globex, oil prices have recovered slightly to trade off yesterday’s lows at $38.71 at time of writing.
From a fundamental perspective we also have to factor in oil’s traditional relationship with the US dollar which has broken down. Oil is not alone in this respect, with equities too having decoupled for the time being. Elsewhere however it is the combined effects of the OPEC price war, coupled with the slowdown in China which have helped to accelerate oil’s progress lower.
Whilst the alternative energy suppliers continue to remain under pressure, and likely for some time to come, they have not yet been taken out of the equation. The turning point for oil will no doubt arrive when OPEC decides enough is enough and capitulates to its members, who for the time being apprear to be towing the line.
Meantime, back to the question of how low can oil go, and the answer as always will come from an analysis of volume and price. For intraday oil speculators, the same methodology applies and works in all timeframes. So, whether you are an oil trader or investor, VPA provides all the answers clearly and clinically. We are not at the bottom just yet which, when it arrives, will be followed by an extended phase of price congestion.
This in turn will be the precursor to any move higher. In addition, we also have to see a move in the VPOC on the daily chart to highlight the congestion phase, or price agreement, and this is likely to be in the mid $30 per barrel price region.

