- S&P 500 futures hit limit-up before trimming advance
- Gold continues to derail portfolios, falling for a seventh straight day
- WTI remains below $30
- Bitcoin plunge to continue
Key Events
Futures for the S&P 500, Dow Jones and NASDAQ wavered this morning, as earlier gains were trimmed after Monday's massive Wall Street selloff, the worst rout since 1987, driven by fears of a coronavirus-triggered global recession. European shares surged at the open, as investors bought on the dip, but then reversed as the fear of how Covid-19 could damage the global economy returned.
Treasurys and the yen retreated, while gold extended a drop. The most elevated index at the moment appears to be the VIX, indicating that market turbulance is close to its highest level in two years.
Global Financial Affairs
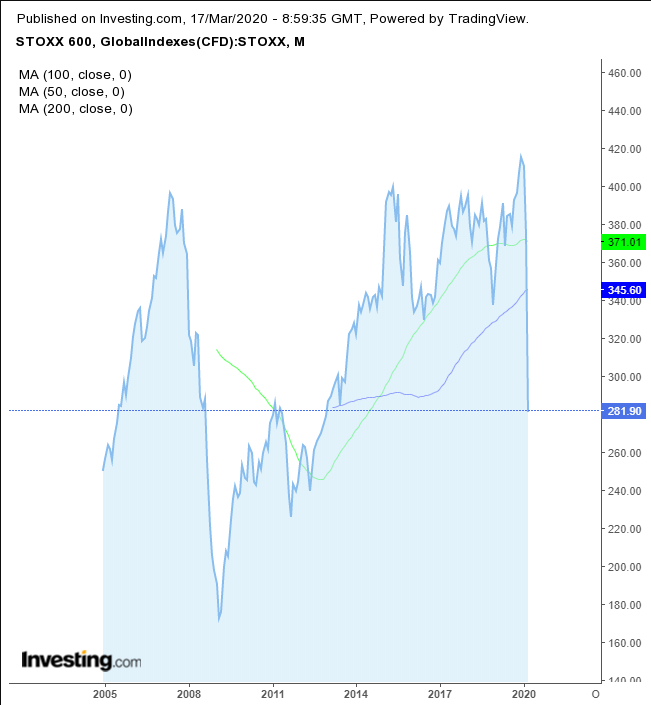
The STOXX Europe 600 Index rebounded from a 7-year low, finding support by the January 2011 highs. However, it failed to hold onto session highs.
Earlier on Tuesday, contracts for the S&P 500 and NASDAQ surged to their 5% limit-up. The Asian session whipsawed, leaving Australia’s ASX 200 5.83% higher—its biggest advance since 1997; South Korea’s KOSPI extended its decline by 2.47%, reaching its lowest point since 2010.
Yesterday, U.S. equities plummeted. The S&P 500 sank 12%, the Dow Jones Industrial Average dropped almost 3,000 points, losing almost 13% of value, after President Donald Trump warned that the virus may disrupt life for months to come and cause a possible recession, after central bank easing didn’t help restore faith in the economy.
The SPX erased all its 2019 gains and lost almost 30%. The Russell 2000 had its worst day on record, diving more than 14%.
Yields for the U.S. 10-year note jumped as Treasurys were sold on renewed risk-seeking, after plummeting almost a quarter percentage point on Monday.
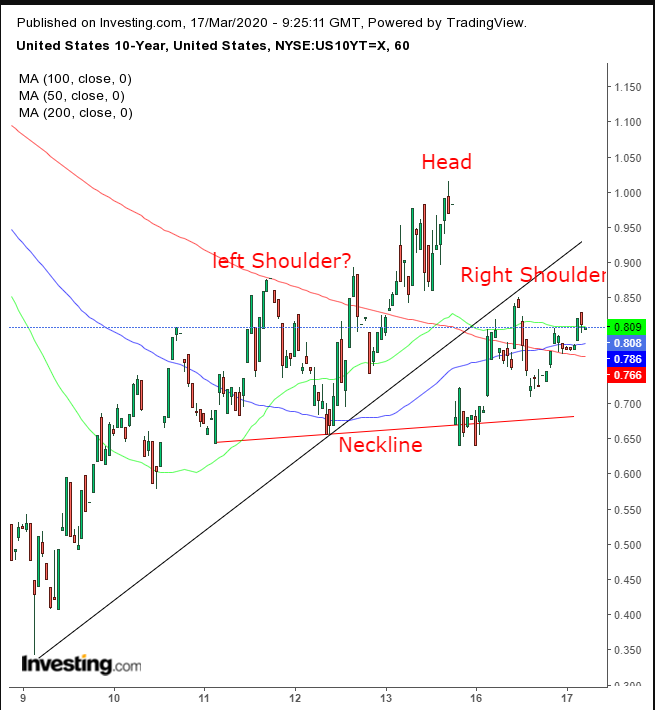
From a technical perspective, yields have resumed an H&S top pattern, as shown yesterday, finding resistance by the broken uptrend line, forming the right shoulder, suggesting the current risk-on sentiment won't last.
The U.S. Dollar Index has regained almost all of yesterday’s losses. We expect the USD could decline in the short-term with the restart of QE and zero rates. However the global reserve currency will strengthen in the long-term since it's the ultimate safe haven amid a market crash. Either way, the dollar is likely to whipsaw wildly before setting a trend.
Another traditional haven asset, gold, fell for a seventh day, slumping below $1,500 and the 200 DMA. The precious metal has bewildered traders, sinking even during the worst stock selloffs in a generation. Likely reason: investors liquidated positions of the yellow metal to pay off margin calls and transactions underlying the contracts disrupted by the global pandemic.
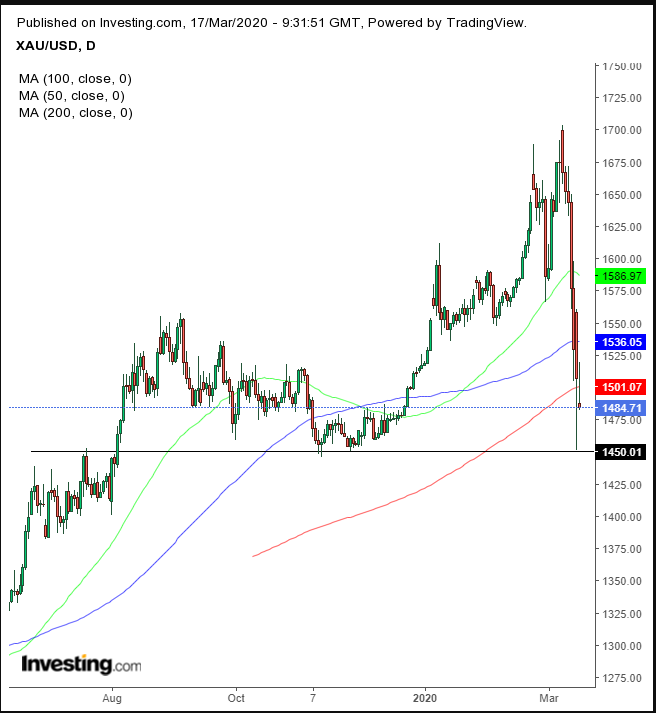
However, the price could find support at an important support-resistance level since June.
Bitcoin has been consolidating, as retail investors seem to be buying while institutions are said to be selling. That’s not a good formula for bulls; institutions tend to have the upper hand in market moves. They have the money and the knowledge.
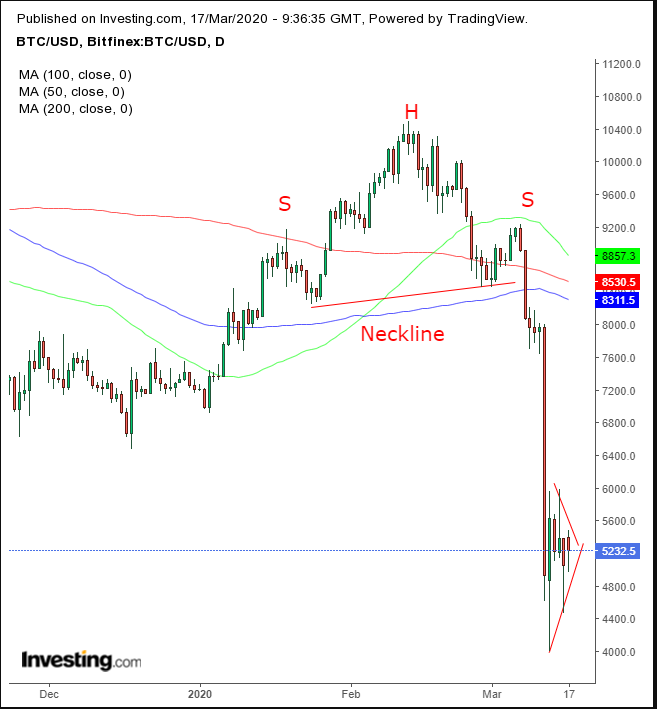
It's clear how that plays out on the chart. The price has developed a pennant, bearish after the preceding, gut-wrenching 40% dead-drop in a single session.
Oil fluctuated, remaining below $30 for a second day, the first time the commodity has hit this level since 2016.
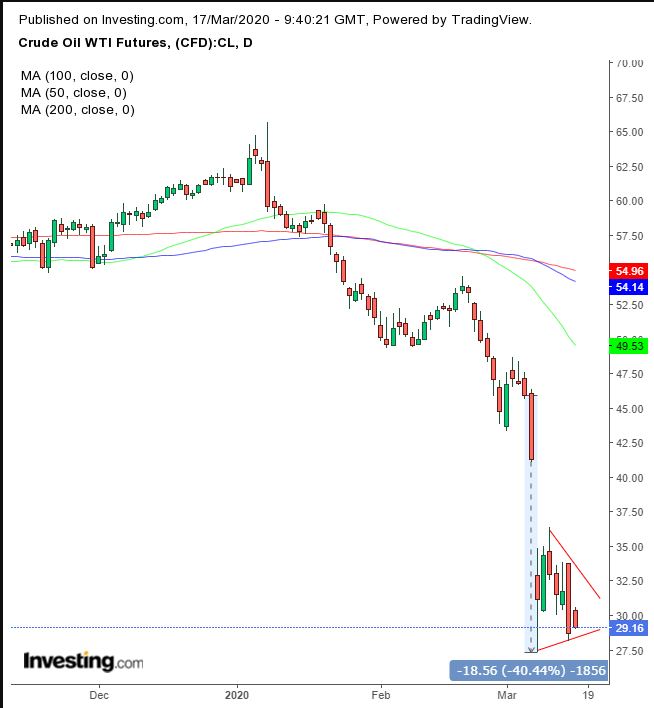
WTI's continuation pattern appears to have deepened, promising another sharp drop upon a downside breakout.
Up Ahead
- U.S. Core and headline retail sales figures will be released on Tuesday, with a slight declined presumed.
- On Wednesday, the Eurozone publishes CPI data, forecast to remain steady at 1.2%.
- Also on Wednesday, U.S. weekly Crude Oil Inventories are released. The metrics are always closely watched, perhaps more so during the current crisis.
Market Moves
Stocks
- Futures on the S&P 500 Index increased 2.3%.
- The Stoxx Europe 600 Index slipped 0.1%.
- The MSCI Asia Pacific Index rose 0.3%.
Currencies
- The Dollar Index climbed 0.4%.
- The euro dipped 0.5% to $1.113.
- The British pound decreased 0.4% to $1.2218.
- The Japanese yen declined 0.8% to 106.70 per dollar.
Bonds
- The yield on 10-year Treasuries increased eight basis points to 0.80%.
- Germany’s 10-year yield rose four basis points to -0.42%.
- Britain’s 10-year yield climbed five basis points to 0.483%.
Commodities
- West Texas Intermediate crude rose 3.5% to $29.70 a barrel.
- Gold fell 1.9% to $1,485.24 an ounce.
