- Risk-off sentiment takes hold after reports of a U.S. probe into China's Huawei
- European shares, US futures reverse after yesterday's U.S. rally
- Sovereign bonds, gold, yen gain
Key Events
European stocks and futures on the S&P 500, Dow and NASDAQ 100 edged lower this morning as the outlook for a trade resolution between the U.S. and China turned sour. Earlier, a mixed performance in Asia failed to sustain yesterday's Wall Street rally that was triggered by positive corporate earnings reports on Wednesday.
The STOXX 600 slipped lower along with banks stocks—which drove yesterday’s rally—after Societe Generale (PA:SOGN) posted guidance of a 20 percent drop in quarterly trading revenue, prompting investors to steer clear of market volatility.
The report that the U.S. is investigating Chinese phone giant Huawei (SZ:002502) for "stealing trade secrets" from U.S. businesses—which touches on an extremely delicate component of the trade dispute with China—contributed to the risk-off shift.
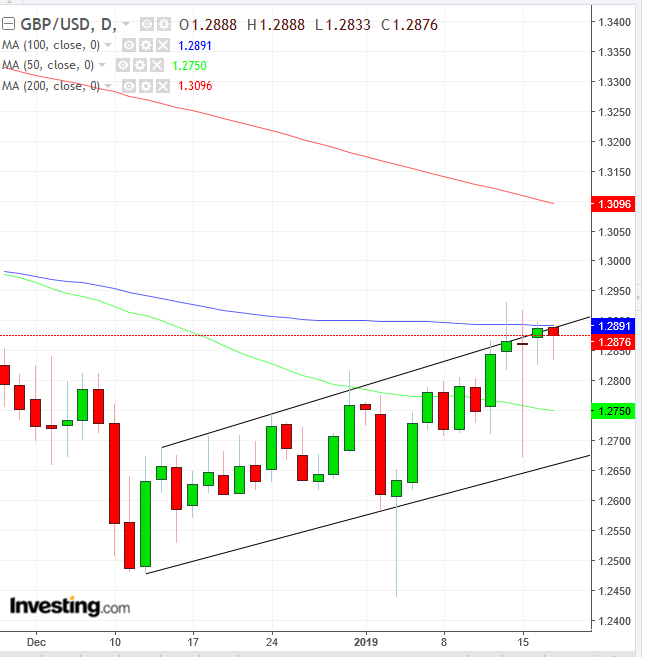
A volatile pound fell, wiping out yesterday’s gains, as UK Prime Minister Theresa May is now faced with the arduous task of negotiating a revised, more acceptable Brexit draft with lawmakers after surviving a no confidence vote on Wednesday night. Technically, sterling found a triple resistance: the 100 DMA, which aligned with the resistance line of a rising channel, and the high prices of the previous three sessions. The current candle is a hanging man in the making. If it closes below yesterday’s hanging man, it would confirm its bearish tilt.
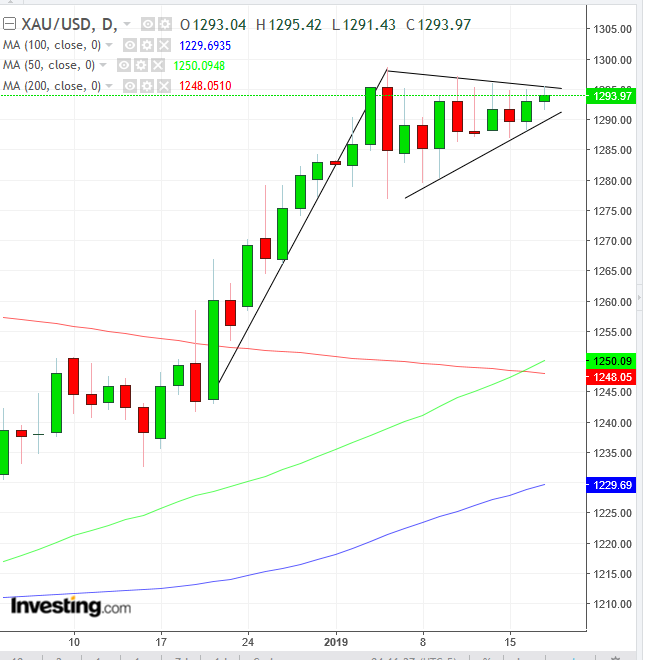
Today’s risk-off sentiment sparked demand for European sovereign bonds, along with U.S. Treasurys—initially boosting the greenback. However, the broad flight to safety also saw the yen and gold strengthen, pushing the USD down. Still, the dollar was back into positive territory in the late European morning.
Technically, for a tenth day, the price of gold is trading within a range that shows bullish implications, confirmed with an upside breakout. The 50 DMA crossed above the 200 DMA, triggering a golden cross throughout the consolidation, increasing the bullish outlook.
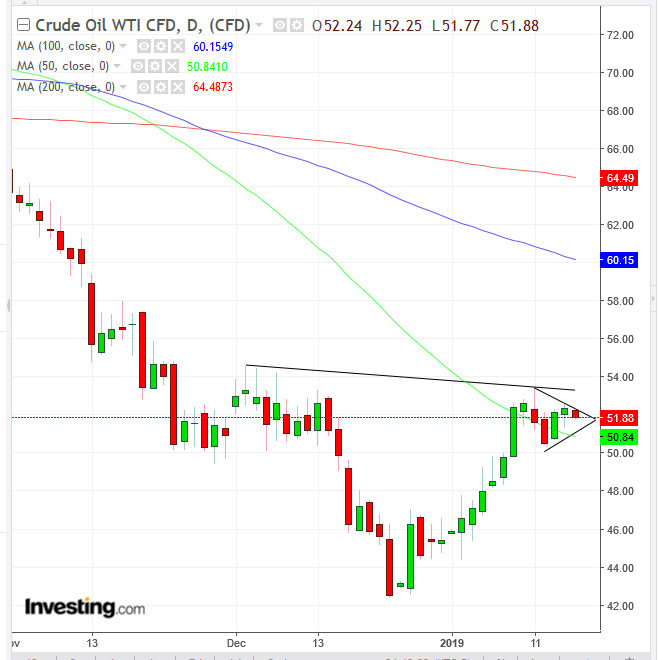
Crude is trading in the same continuation pattern as gold, confirming the wait-and-see approach investors are taking on the global economic growth trajectory—with gold gaining on defensive plays and oil gaining on risk moves. However, regional supply disruptions could weigh on oil markets going forward, changing the commodity dynamic once again.
Global Financial Affairs
In yesterday's U.S. session, equities advanced as the earnings season started off on the right foot, offsetting concerns about the outlook for U.S.-China trade negotiations.
The S&P 500 advanced for a second day, closing 0.22 percent higher but giving up a more attractive 0.59 percent gain. The index price formed a shooting star after touching the downside of the 50 DMA, after the 100 DMA crossed below the 200 DMA. Sector structure continued to show an irregular pattern, with both defensive and cyclical sectors gaining and losing interchangeably.
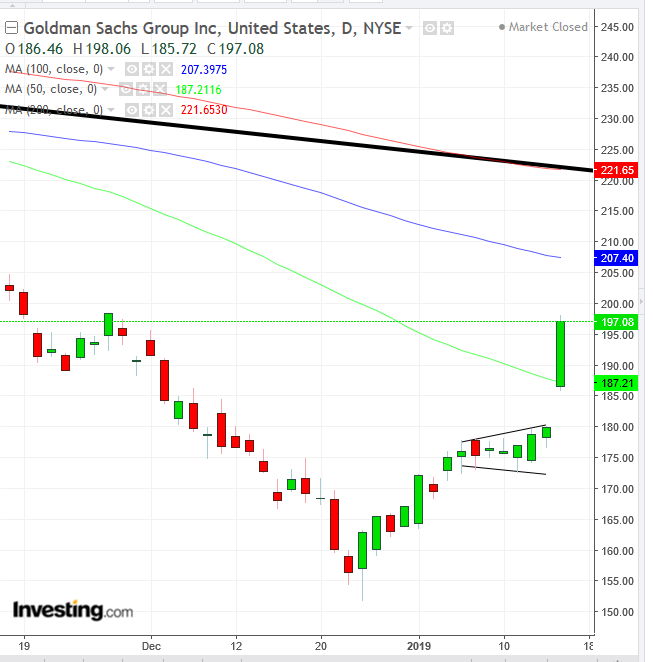
Financials (+2.13%) were the clear sector winners of the session, buoyed by positive earnings results from Goldman Sachs (NYSE:GS) and Bank of America (NYSE:BAC) the second-best performer, Real Estate (+0.47%), came in as much as 1.66 percent behind.
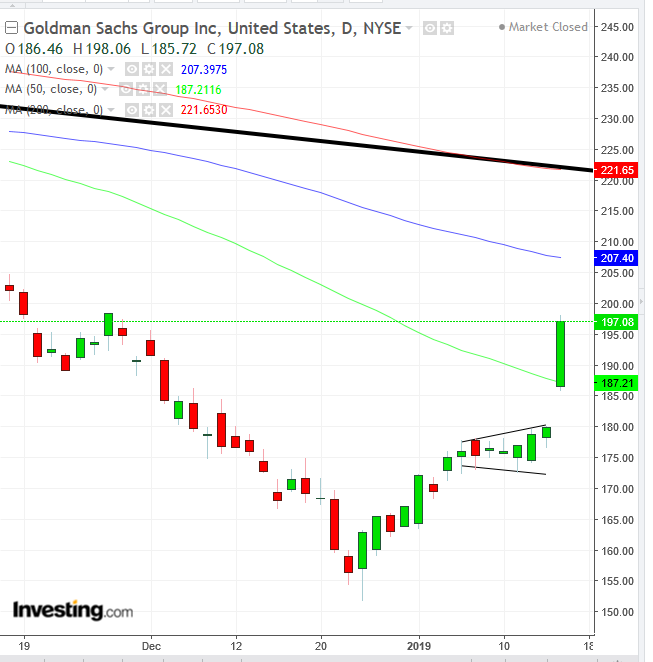
While we had argued that Goldman's upbeat earnings were already visible in the previous price action, yesterday's jump brought the stock's total post-Christmas rebound to 23.14 percent, putting it well within bull market territory, with the onus on the bulls to carry the stock higher against a downtrend. Bank of America is showing the same technical dynamic the investment bank.
Meanwhile, the Russell 2000 and the Dow Jones Industrial Average both gained 0.59 percent, with the latter probably also finding resistance by the 200 DMA.
The NASDAQ Composite underperformed, inching just 0.15 percent higher, paring an initial 0.77 percent gain. It took a hit from the news that Huawei is under investigation by U.S. authorities.
Overall, the recent double-digit rebound of U.S. indices, which pulled them back from the brink of a bear market, is showing signs of fatigue. Traders seem to have woken up to ongoing headwinds after only focusing on three significant tailwinds: central bank support, signs of a possible breakthrough in U.S.-China talks and upbeat jobs numbers.
Now, the longest U.S. government shutdown on record, heightened Brexit uncertainty and a lack of foreseeable solutions to the trade spat seem to be back at center stage. From our perspective, this strengthens the case for the end of what we predicted to be the last rally of this bull market.
Up Ahead
- Morgan Stanley (NYSE:MS) is due to post earnings before market open. EPS is seen at $0.90, from $0.84 for the corresponding quarter last year.
- Netflix (NASDAQ:NFLX) is expected to report earnings after market close, with a $0.25 EPS, lower than the $0.41 posted for the same quarter last year.
- Data on U.S. jobless claims and industrial production are due today and tomorrow.
- Eurozone inflation is scheduled for Thursday.
Market Moves
Stocks
- Futures on the S&P 500 dropped 0.5 percent.
- The STOXX Europe 600 fell 0.5 percent.
- The MSCI All-Country World Index slipped 0.1 percent.
- The MSCI Emerging Market Index slid 0.2 percent.
Currencies
- The Dollar Index eked out a 0.01 percent to 96.09, as it struggles against the 96.00 for the third day, after it finally surpassed the 100 DMA.
- The euro dropped less than 0.05 percent to $1.1388, reaching the weakest in more than two weeks on its sixth consecutive decline.
- The Japanese yen gained 0.3 percent to 108.80 per dollar.
- The British pound slid 0.3 percent to $1.2851, the biggest fall in a week.
- The MSCI Emerging Markets Currency Index fell 0.2 percent to the lowest in more than a week on the largest decrease in more than a week.
Bonds
- The yield on 10-year Treasurys fell two basis points to 2.70 percent.
- Germany’s 10-year yield dropped two basis points to 0.21 percent.
- Britain’s 10-year yield fell two basis points to 1.293 percent.
- The spread of Italy’s 10-year bonds over Germany’s rose two basis points to 2.5494 percentage points.
Commodities
- The Bloomberg Commodity Index climbed less than 0.05 percent, reaching the highest in almost five weeks on its fifth straight advance.
- West Texas Intermediate crude fell 0.8 percent to $51.87 a barrel.
- LME copper gained 0.1 percent to $5,975.00 per metric ton, the highest in almost three weeks.
- Gold slipped 0.1 percent to $1,292.72 an ounce.
