- US futures point to extended rally, after bottoming on intra-day chart
- Oil prices after inventories show unexpected drawdown
- Dollar remains weak
Key Events
US contracts pointed to a higher open on Wednesday and European stocks edged higher ahead of the FOMC policy meeting today.
The Fed is not expected to change interest rates at its first meeting since it outlined its new framework for economic policy. But, the market is looking for additional details on how long the average inflation figure will be permitted to remain above 2% before it will feel obligated to raise rates.
Global Financial Affairs
Investors cautiously tweaked positions to place global markets in a holding pattern as they wait for the Fed's policy announcement.
Markets are hoping for some improvement in the central bank’s economic forecasts, as well as reaffirmation of market support while we await additional coronavirus relief packages from US lawmakers, in order to justify buying the biggest dip in months.
All four major US contracts, Dow, S&P, NASDAQ and Russell 2000, were up this morning, with those on the NASDAQ 100 returning to outperformance (+1.4%) having led the selloff.
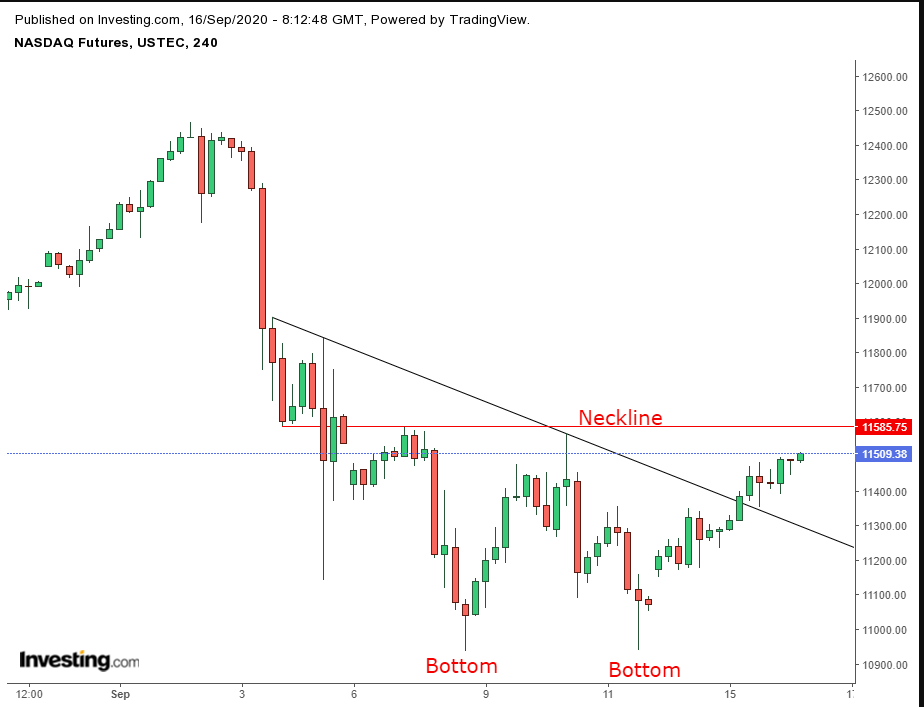
The contract on the NASDAQ 100 is attempting to double-bottom the 4-hour chart.
The Stoxx Europe 600 Index advanced 0.5%, extending its rally for the fourth straight day on the back of strong results from the retail sector—Zara-owner Inditex (MC:ITX) announced a return to quarterly profit this morning and yesterday H&M (OTC:HNNMY)'s results exceeded expectations.
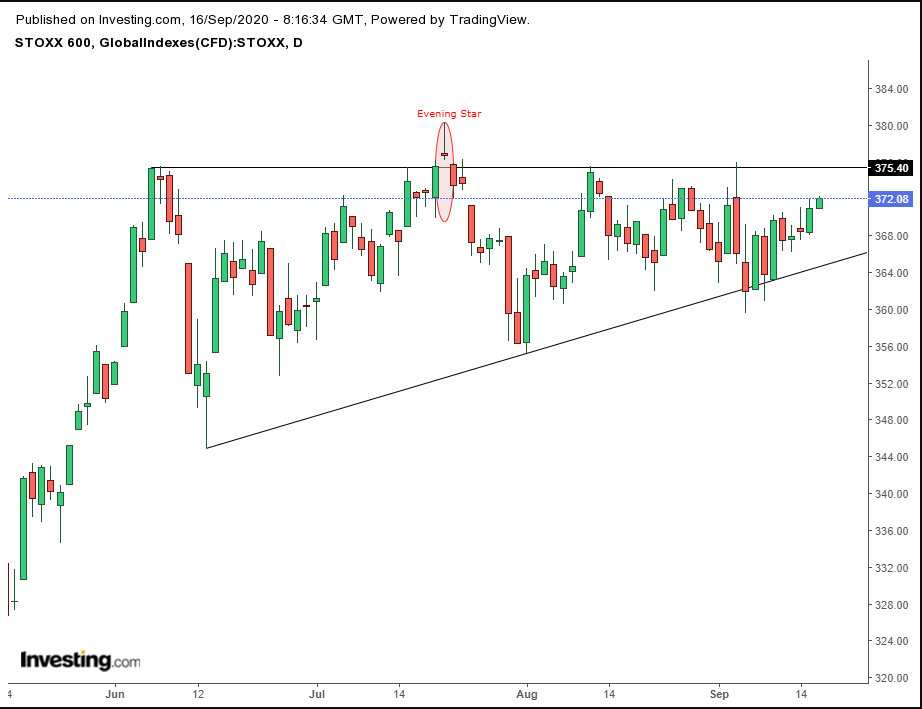
The pan-European index inched toward the top of an ascending channel, a pattern that demonstrates that buyers are gaining incremental footholds into seller’s territory.
Asia was mixed with tech stocks leading Australia’s ASX 200 (+1%) to a weekly high—outperforming the region. China’s Shanghai Composite (-0.4%) snapped a three-day rally, weighed down by consumer and healthcare shares after experts voiced concerns over the safety of drugs used in experimental coronavirus vaccines in the country.
American equities managed a higher close Tuesday, as tech shares offset a late selloff in financials, including JPMorgan Chase (NYSE:JPM), Citigroup (NYSE:C) and Bank of America (NYSE:BAC). The S&P 500 Index climbed for the third straight day, with communication services, real estate, and consumer discretionary shares outperforming.
Yields, including for the 10-year benchmark Treasury, have been ranging for the third day, but the dollar returned to a slide.
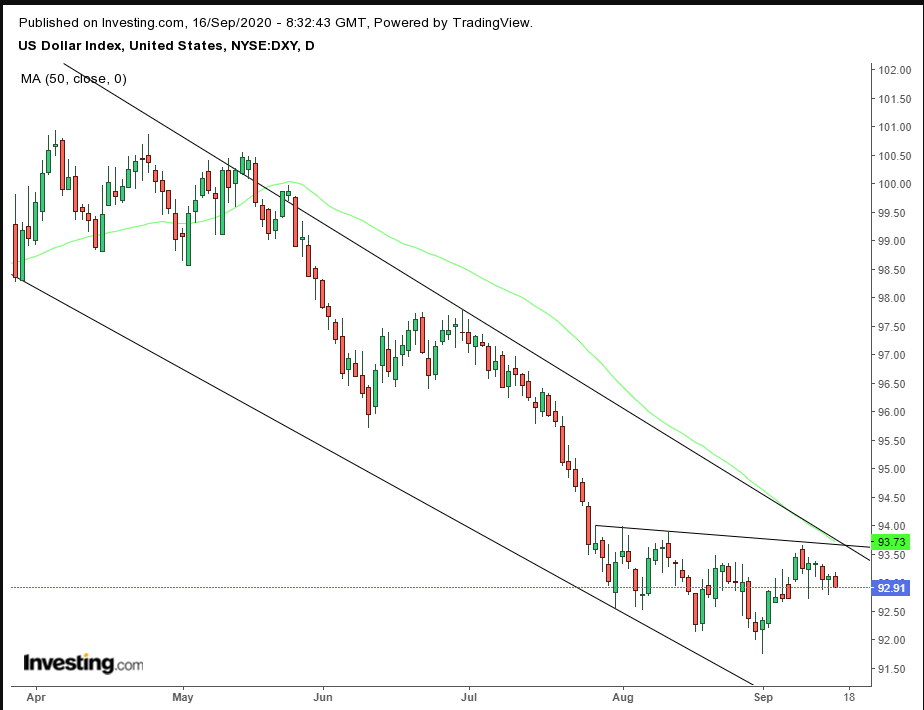
While the dollar may have been dropping within a falling channel, its trading pattern since late-July allows for a bottom in the shape of a H&S.
Dollar weakness boosted gold for the third day, after it may have completed a bullish pennant (blue).
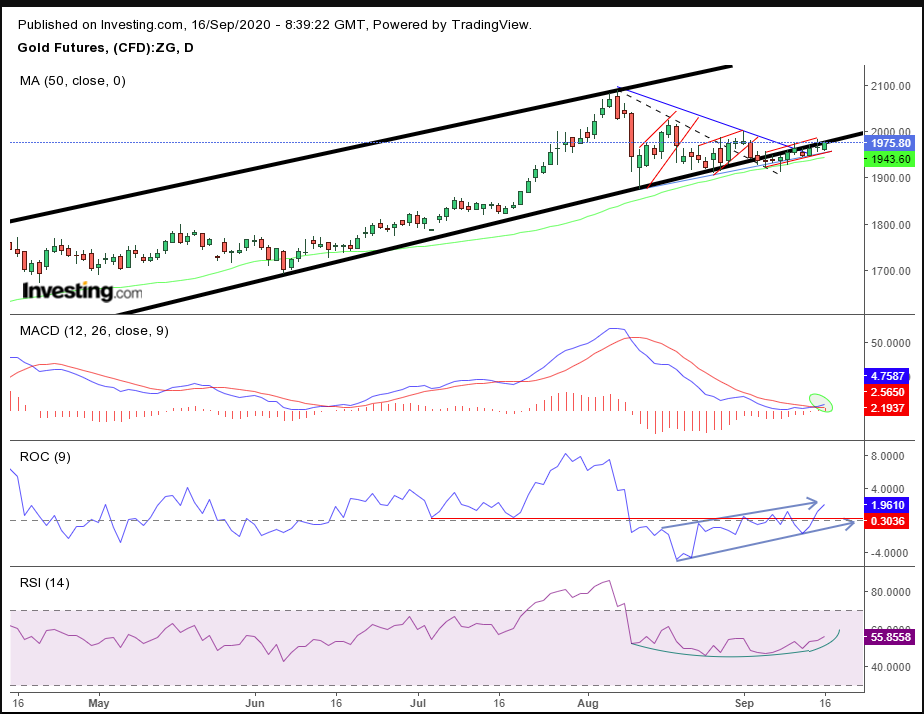
Alternatively, the precious metal may be forming a third consecutive bearish flag—resisted by the rising channel’s bottom. Only a strong move over $2,000 will clear this self-contradictory pattern. Momentum and price-based indicators seem to be in favor of the bullish pennant scenario.
Bitcoin climbed for the third day in a row, blowing out what would have been a bearish pennant—turning it bullish—following a H&S top. It would be interesting to see which pattern’s dynamics will win, the bearish H&S or the now-bullish pennant.
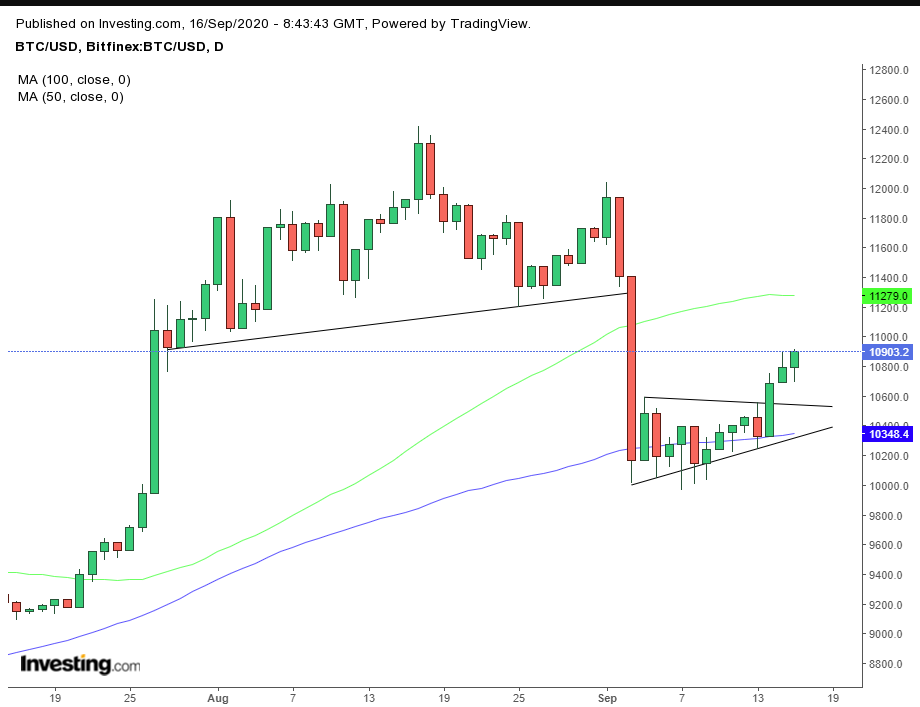
The cryptocurrency's H&S is larger and therefore has more vested interest, but on the other hand its minimum implied target has already been achieved on the first day of the solid downside breakout. Note, the 100 DMA supports the pennant, while the 50 DMA adds resistance to the H&S.
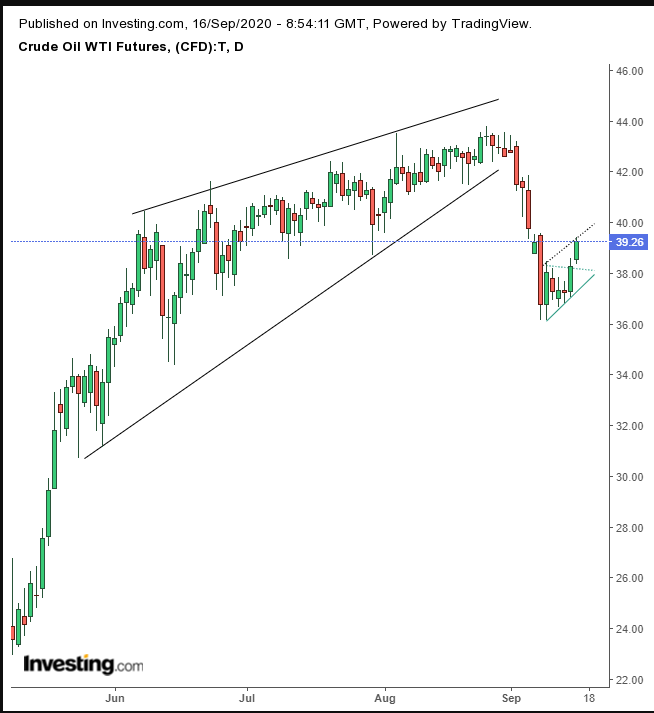
West Texas crude oil extended gains after a surprise American stockpiles drop.
Up Ahead
- Wednesday sees the FOMC policy decision and news conference from Chair Jerome Powell.
- Bank of Japan, Bank Indonesia and Bank of England policy decisions due Thursday.
- Friday sees quadruple witching—the quarterly expiration of futures and options on indexes and stocks—in US markets
Market Moves
Stocks
- Futures on the S&P 500 Index increased 0.3%.
- The Stoxx Europe 600 Index gained 0.3%.
- Germany’s DAX Index advanced 0.2%.
- The MSCI Asia Pacific Index advanced 0.4%.
Currencies
- The Dollar Index declined 0.2% to 92.94.
- The euro was little changed at $1.1852.
- The Japanese yen strengthened 0.1% to 105.35 per dollar.
- The British pound was little changed at $1.2886.
Bonds
- The yield on 10-year Treasuries dipped less than one basis point to 0.67%.
- Germany’s 10-year yield dipped one basis point to -0.49%.
- Britain’s 10-year yield declined one basis point to 0.206%.
Commodities
- West Texas Intermediate crude increased 2.1% to $39.10 a barrel.
- Gold strengthened 0.5% to $1,963.98 an ounce.
