Netflix (NASDAQ:NFLX) is scheduled to announce Q1 2020 results Tuesday after market close — and investors appear to have already cast their votes. Shares of the streaming entertainment giant dropped 3.7% on Friday, even as the broader market soared.
The Nasdaq Composite, where Netflix is listed, gained 1.4% during the final trading session of last week, while the S&P 500 rallied 2.7% and the Dow surged 3%.
Friday's plummet came after Benchmark analyst Matthew Harrigan set the stock’s target price at $327, implying a downside of 25%, citing production disruption and intensifying competition from Disney's (NYSE:DIS) Disney+ service and AT&T's (NYSE:T) HBO Max, among others.
While the COVID-19 related slowdown in the creation of continuous fresh content is being offset by studios offering to sell their material to Netflix amid empty movie theaters, tempering the risk of customer-losses due to a lack of fresh, compelling production, it's also true that Netflix's rivals have the same access to these releases.
Does Friday's decline mean Netflix shares are headed lower still? Tracking the technical patterns can help interpret what these moves may be suggesting.
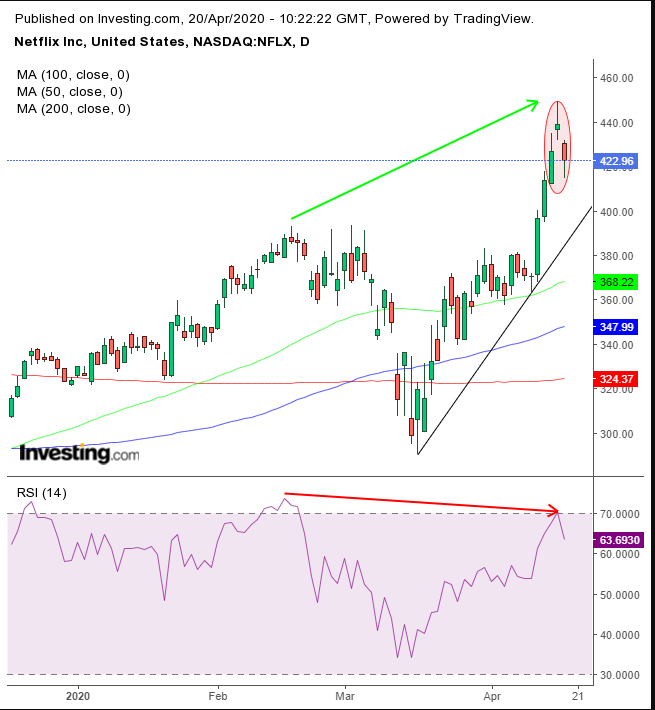
Looking at the chart, it's clear that Netflix is in an uptrend. However, on Friday it completed an Island Reversal (western technical analysis) or an Evening Star (Japanese candlesticks) — a three-candle bearish signal, demonstrating a reversal, at least in the short term.
Even so, the pattern’s bearishness was muted by Friday’s close, which was well off its lows, pushing prices back toward the top of the first candle in the formation, demonstrating remaining demand.
The RSI hit the minimum overbought level of 70 and dropped to 63.7, producing a sell signal. More impressive, the momentum indicator produced a negative divergence, when it failed to follow the price from $387.78, registered on Feb. 18, to its new all-time high on Thursday, of $439.17 — thus increasing the risk of the price falling for lack of interest.
Notably, the price closed below the previous all-time high of $423.21, posted on June 21, 2018. The fact that the price was unable to remain above that high suggests supply overcame demand at these levels.
Contrary to Matthew Harrigan's view on the stock, however, we are still bullish on Netflix. We see Friday's decline as a profit-taking pullback, toward its uptrend line.
However, if Harrigan is right, and the price does fall to $327 — well below its pre-coronavirus selloff peak on Feb. 19, the trend will have gone sideways and we’ll have to reassess.
For now, we expect a corrective decline within the uptrend.
Trading Strategies
Conservative traders would wait for the Island Reversal/Evening Star and divergence in momentum to play itself out and wait for confirmation of newfound demand, hopefully above the uptrend line – and preferably above the psychological $400 number – but certainly above the Feb 19 peak. If that level fails, they’d wait for a new trend to take place.
Moderate traders may risk a long position upon a return to $400 area.
Aggressive traders are likely to short.
Trade Sample - Short Position
- Entry: $430 (bearish patterns often retest resistance, before heading lower)
- Stop-Loss: $437 (above the gap)
- Risk: $7
- Target: $409
- Reward: $21
- Risk:Reward Ratio: 1:3
Note: A trade sample is a device to convey the key components of a coherent trade plan. Not every trade can win. No trade is suitable for all traders. Feel free to change the entry points, stop-loss and target per your temperament and capital, but you must trade according to your preset plan, or your trade results — good or bad — will be meaningless.
