In March 2020, during the early days of the pandemic, the cash price of copper hit a multi-year low of $4,617 per tonne on the London Metal Exchange, which is owned by the Hong Kong Exchanges and Clearing.
Then, recently, along with many asset classes, but especially commodities, copper surged to reach the current multi-year highs of around $9,990 (we should note that the futures prices at the CME, owned by the CME Group (NASDAQ:CME) are quoted per pound and are currently shy of $4.6). Year-to-date, copper is up about 28%.
Meanwhile, markets are also paying attention to silver and gold prices. So far this year, silver is up about 4%, and gold is down about 6%. Precious metal bulls are hoping for a rally in these metals for the rest of the year.
In previous articles we covered several FTSE 100 mining groups. They include:
- Anglo American (LON:AAL) (OTC:NGLOY) — up ~ 27% YTD (covered here);
- Antofagasta (LON:ANTO) (OTC:ANFGF) — up ~ 28% YTD (covered here);
- BHP Group (LON:BHPB) (NYSE:BHP) — up ~ 19% YTD (covered here);
- Fresnillo (LON:FRES) (OTC:FNLPF) — down ~ 24% YTD (covered here);
- Glencore (LON:GLEN) (OTC:GLNCY) — up ~ 26% YTD (covered here); and
- Rio Tinto (LON:RIO) (NYSE:RIO) — up ~ 13% YTD (covered here).
Today, we extend the discussion to another FTSE 100 member, namely Polymetal International (LON:POLYP) (OTC:POYYF), a miner that might appeal to readers who are bullish mainly on gold, silver and copper.
Polymetal International

Precious metal mining group Polymetal International operates in Russia and Kazakhstan. Its most important mine is Kyzyl in northeastern Kazakhstan. Although most investors associate the group’s operations with gold, it also mines other metals like silver and copper.
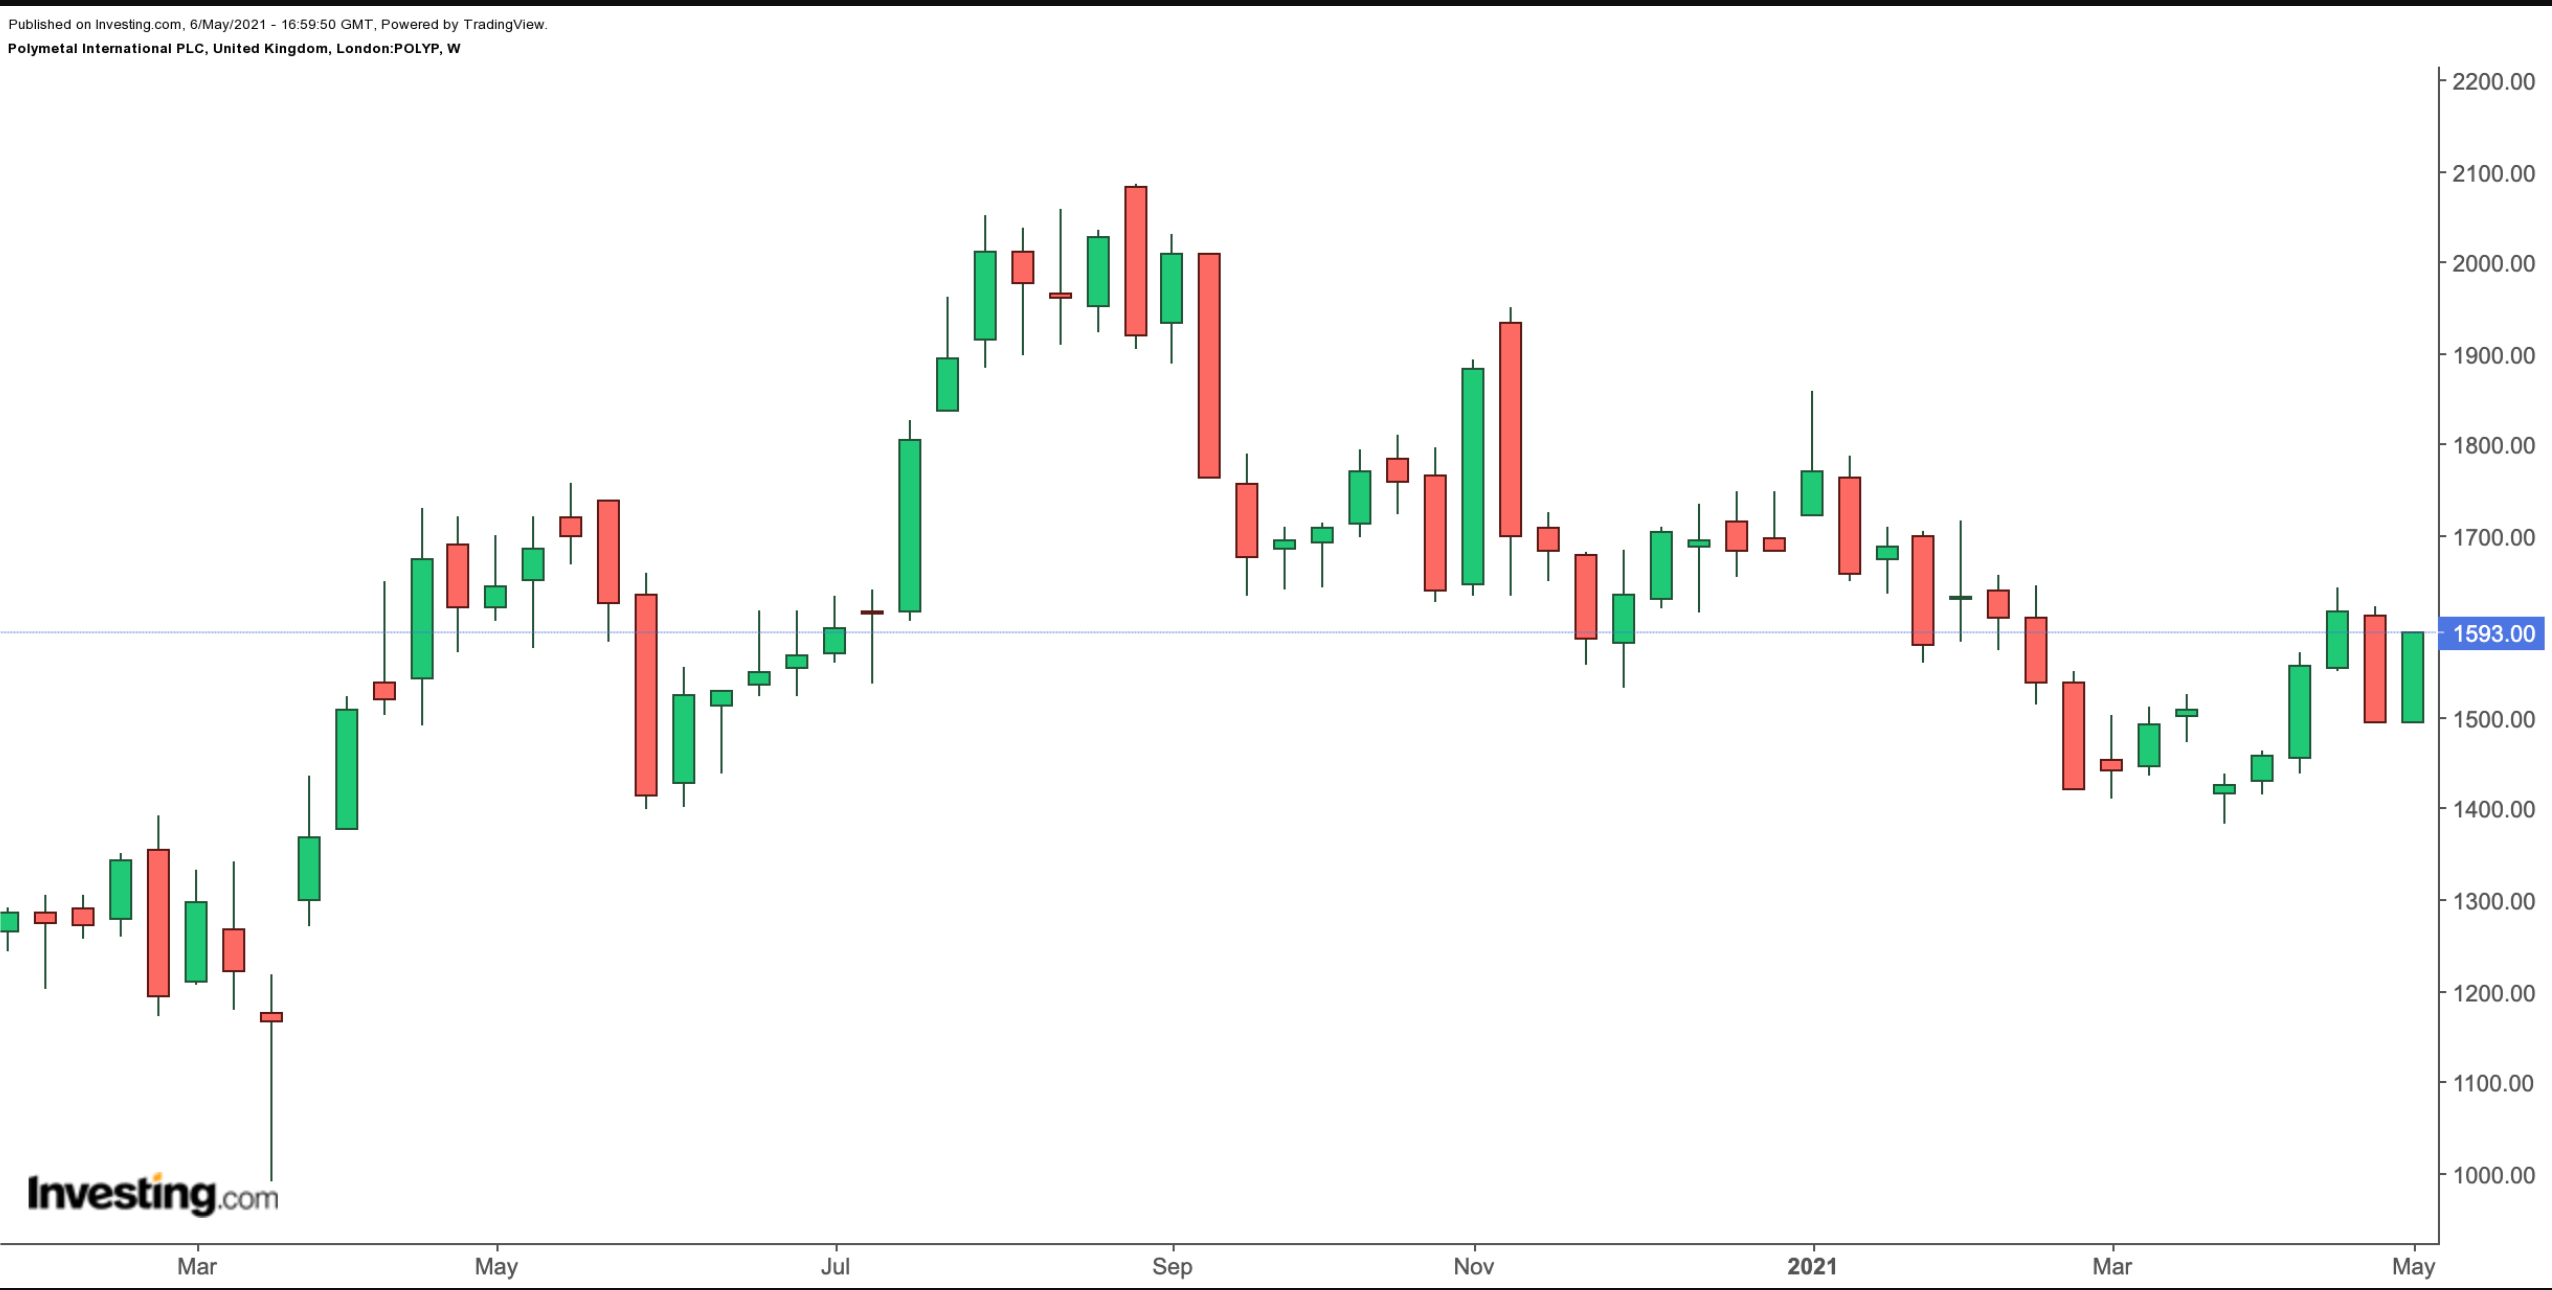
POLYP shares, which are down about 8% YTD, closed at 1,593p (or US$26.76) on May 6. In other words, the share price has mirrored that of gold in the past several months. The current price supports a dividend yield of 5.8%, and the market capitalization stands at £7.53 billion (or US$10.46).
On Mar. 3, the group released preliminary results for the year, which ended on Dec. 31. In 2020, revenue increased by 28% year-on-year, totalling $2.86 billion. A year ago, it had been $2.24 billion. In 2020, net earnings were a record $1,086 million, with a basic EPS of $2.30 per share. In 2019, the comparable numbers had been $483 million and $1.02 per share.
Free cash flow came in at $610 million, compared with $256 million in 2019. Finally, the total dividend declared for FY 2020 was $1.29 per share, up 57% compared with 82 cents per share in 2019. Analysts were overall pleased with the robust results.
Production results released on Apr. 22 further showed Q1 FY21 revenue as $593 million, up 20% YoY.
Group CEO Vitaly Nesis said:
“In Q1 2021, Polymetal delivered strong production, strong free cash flow, and steady progress across development projects.”
POLYP stock’s forward P/E and P/S ratios are 10.86 and 3.55, respectively. We like the shares at the current level and would consider investing for the long term. Potential price increases in precious metals, especially gold and silver, would continue to provide tailwinds for POLYP stock. Passive income seekers would also be entitled to juicy dividends.
Bottom Line
Our regular readers would know that we are bullish on metals, including copper, gold and silver. Low interest rates in the US, UK and in numerous countries will mean many investors will allocate a part of their portfolio to commodities. A large number of mining stocks will likely keep on dazzling.
Those investors who are not ready to commit capital into a single stock like POLYP could also consider buying an ETF. Examples include:
- ETFMG Prime Junior Silver Miners ETF (NYSE:SILJ) — up ~ 1.5% YTD;
- Global X Silver Miners ETF (NYSE:SIL) — down ~ 0.4% YTD;
- Global X Copper Miners ETF (NYSE:COPX) — up ~ 40.5% YTD;
- iShares MSCI Global Gold Miners ETF (NASDAQ:RING)— up ~ 3.4% YTD;
- iShares MSCI Global Silver and Metals Miners ETF (NYSE:SLVP) — down ~ 2.2% YTD;
- United States Copper Index Fund (NYSE:CPER) — up ~ 30.3% YTD;
- VanEck Vectors Gold Miners ETF (NYSE:GDX) — up ~ 2.4% YTD.
