The global pandemic affected numerous sectors of the economy as lockdowns forced people to stay at home. Online retailers suffered as social restrictions meant people stopped buying clothes.
Since then, shares of most US retailers have recovered, with some even hitting new highs. For example, year-to-date (YTD) the Dow Jones Retailers is up more than 36%.
Meanwhile, on the other side of the Atlantic, here is how the shares of several FTSE retailers have fared year-to-date (YTD):
- ASOS (LON:ASOS) (OTC:ASOMY): up 2% YTD;
- Boohoo (LON:BOOH) (OTC:BHOOY): down 9% YTD;
- Burberry (LON:BRBY) (OTC:BURBY): up 16% YTD;
- JD Sports Fashion (LON:JD) (NASDAQ:JD) : up 2% YTD
- Next (LON:NXT) (OTC:NXGPY): up 12% YTD.
Therefore, today we look at the online fashion retailer Boohoo to discuss whether the stock deserves to be on investors' watchlist.
According to metrics from the UK's Office for National Statistics:
"Retail sales volumes continued to recover in March 2021, with an increase of 5.4% when compared with the previous month.... Non-food stores provided the largest positive contribution to the monthly growth in March 2021 sales volumes, aided by strong increases of 17.5% and 13.4% in clothing stores and other non-food stores, respectively. Food stores reported monthly growth of 2.5% in March 2021."
The number of people who have received a first dose COVID-19 vaccination in the UK stands close to 36 million, which is over half the population. About half of the 36 million have also had their second doses. Finally, the number of daily new confirmed cases is less than 2,300.
As restrictions gradually ease up, many retail businesses are becoming more optimistic about the upcoming summer months. The pent up demand to visit retail establishments in person could potentially put further pressure on e-commerce retailers like Boohoo. With that information, let's now see if BOOH stock can do better in the near future.
Boohoo
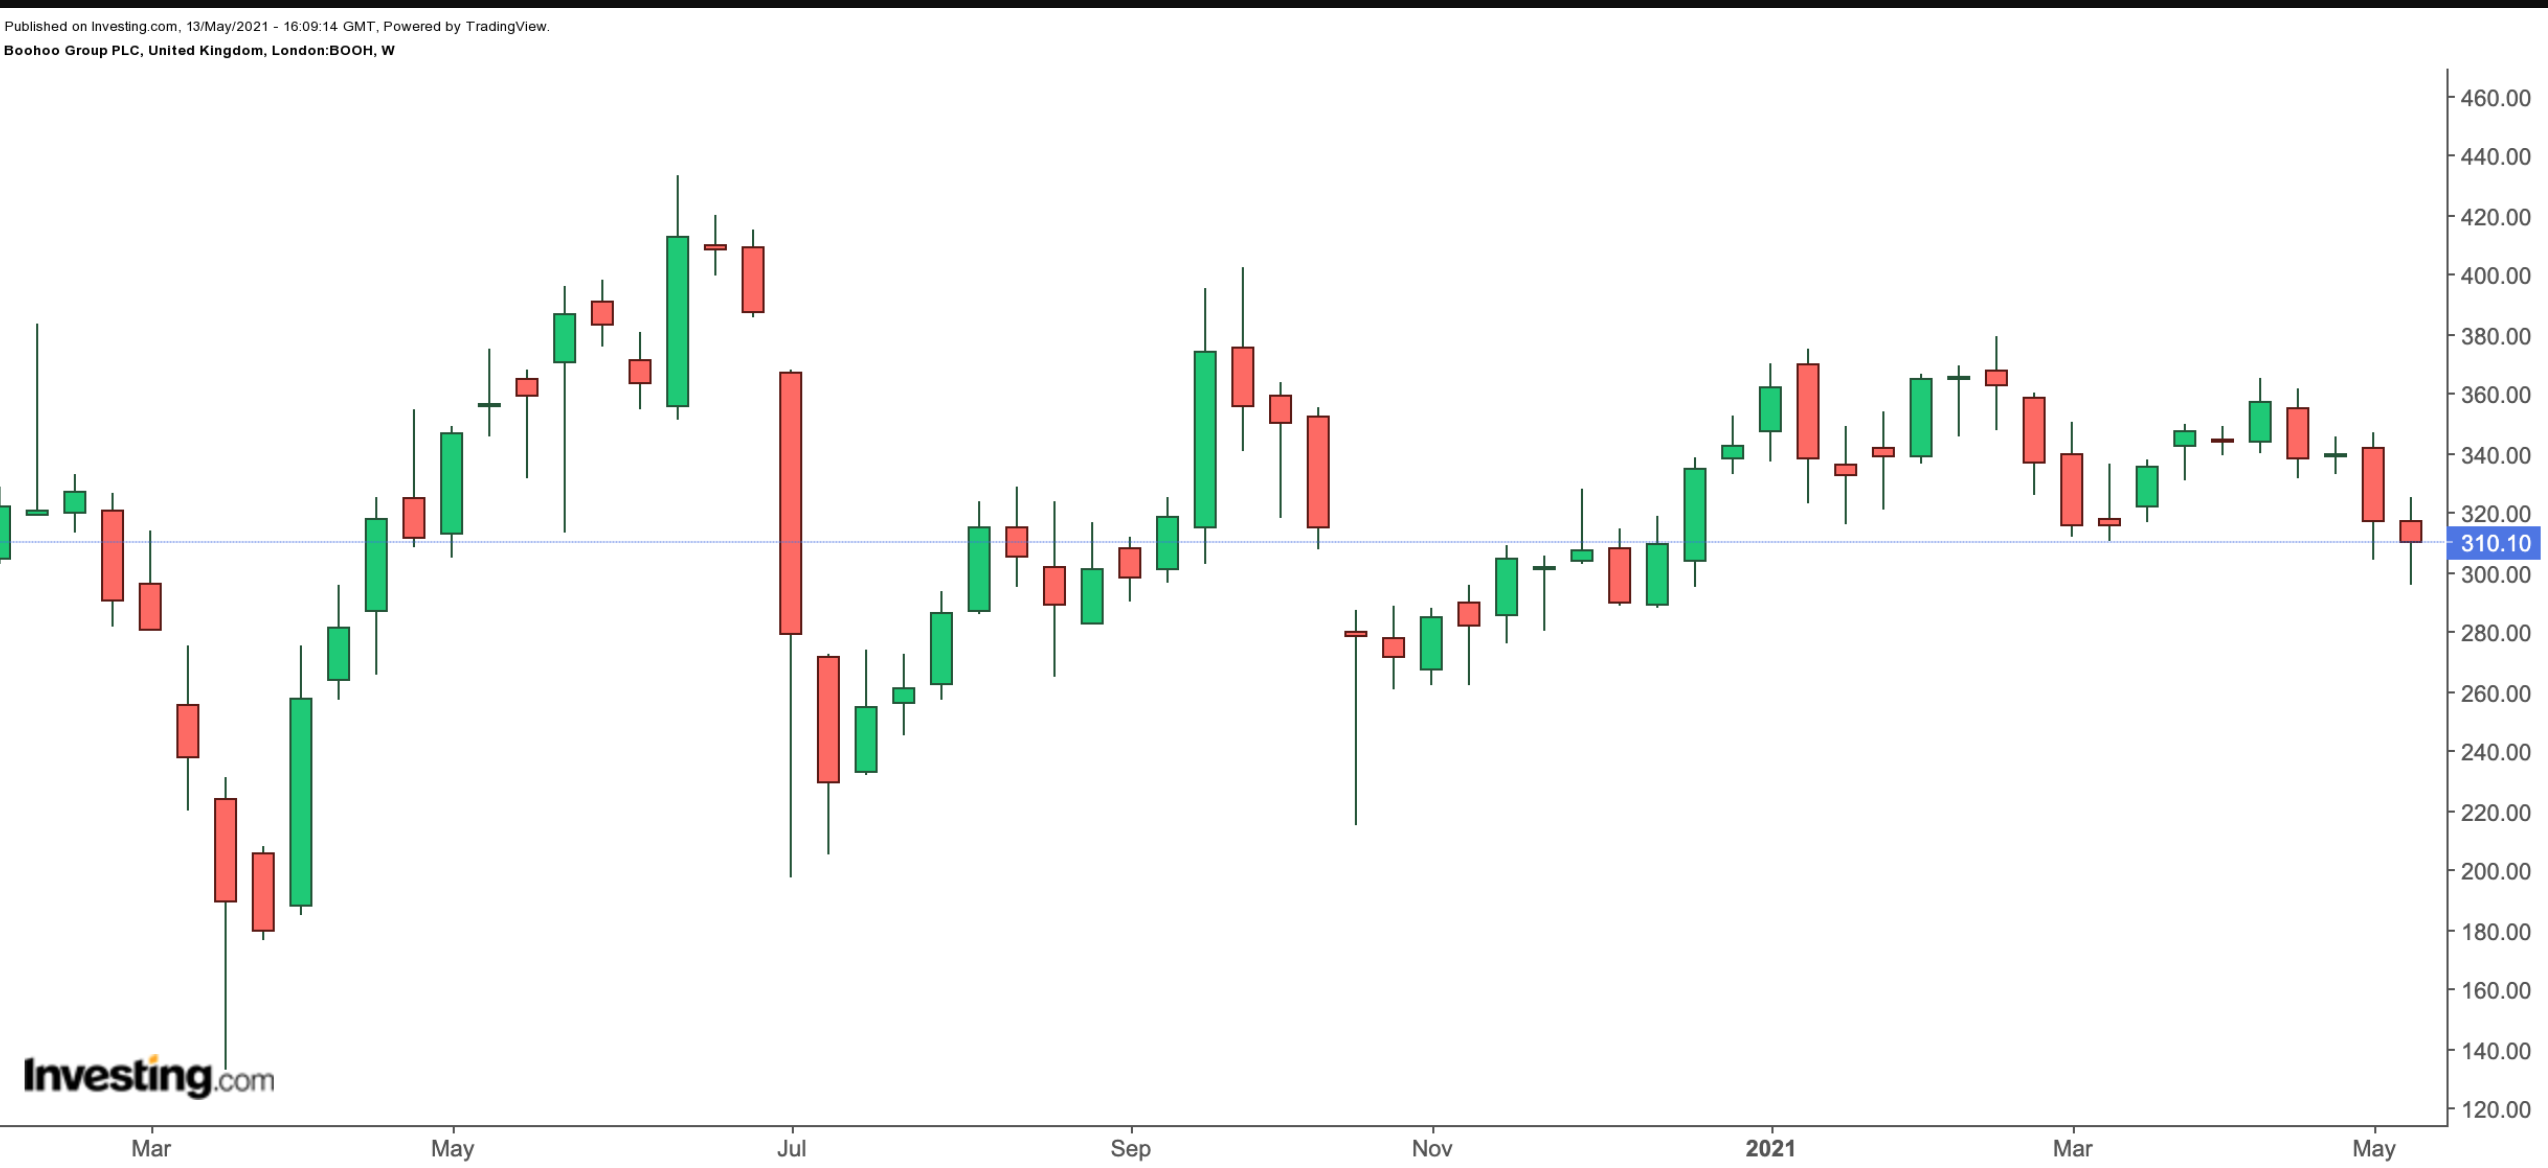
Manchester-based Boohoo began trading in 2014 at an opening price of 70p. Over the past decade, it has become a widely recognized name within the UK fashion market. Its international offices have expanded to the US, France and Australia. On May 13, BOOH shares closed at 310.1p. Its market capitalization stands at £3.92 billion (or $5.5 billion).

Last year, the group experienced supply-chain issues. In July 2020, local newspaper headlines regarding employment conditions at some of its UK-based suppliers put pressure on the shares. It was alleged that many employees were being paid less than the legal minimum wage. BOOH stock was around 200p at the time. But since then the shares are up about 50%.
In early May, Boohoo released metrics for the year ended Feb. 28. Revenue was £1.745 billion (or $2.45 billion), up 41% year-on-year (YoY). Potential investors might be interested to know that the group’s international revenue is now 46% of total sales, up from 45%. Profit before tax also increased by 35% to £124.7 million (or $175.2).
CEO John Lyttle commented:
“FY21 has been a year of significant investment for the group as we build a platform for the future, and I am very pleased to report a strong financial performance. Our established businesses have continued to grow across all territories as we gain market share with our compelling consumer proposition.”
Management sounded optimistic as it expects to see full-year revenue growth of 25%. Analysts were overall pleased with the numbers. However, the share price gives a different and rather choppy picture. BOOH stock’s forward P/E and P/S ratios of 26.60 and 2.21 point to an overstretched valuation level.
Bottom Line
We would not yet be buyers of BOOH shares. Store-based competition could easily take a bite out of its online sales in the next several months, putting pressure on the stock. A post-lockdown decline for online businesses could be expected. Thus, a potential drop to below 300p, especially toward the 280p level would improve the risk/return profile.
Those investors who would like to consider adding retailers, including e-commerce firms, to their portfolios could also consider an exchange-traded fund. Examples include:
