In early July, shares of many China-based companies hit their highest levels in recent weeks. The run-up in price followed a front-page editorial July 6th in the state-owned China Securities Journal, that effectively encouraged investors to purchase stocks, saying a "healthy bull market" would be good for the Chinese economy.
The Shenzhen Composite index, up about 30% year-to-date (YTD), is now at a level not seen since 2015. Similarly, the Shanghai Composite index has just made a new 52-week high, rising over 9% YTD.
This upswing in prices has left many wondering which Chinese stocks would be beneficial for long-term portfolios. Exchange-traded funds (ETF) focusing on the Chinese market facilitate investment in a basket of such stocks. Below we’ll take a deeper look at growth potential in the Chinese market and two ETFs that deserve further due diligence:
China's Growth Story Likely To Remain Intact
China—the world's most populous nation at approximately 1.43 billion—is the second-largest economy behind the US.
The long-term bullish expectations for Chinese stocks in this new decade is rather simple: a rising middle class, greater consumption and increased mobile user penetration are just a few of the catalysts expected to spur company revenues in China. For example, e-commerce has shown rapid-expansion in China in recent years, currently representing about 35% of the nation's $5.5 trillion retail market, while in the US, e-commerce accounts for only 11% of total retail sales.
Readers may recall that in parts of 2018 and 2019 the rhetoric around US-China trade war affected many Chinese stocks and equity funds, which were often further impacted by currency fluctuations.
When COVID-19 pandemic started to spread in early 2020, broader markets priced in a decline in Chinese economic activity. As a result, by early spring, many stocks hit lows not seen in several months, but the stellar run-higher since reminds us that the country may be on track for expansion again.
In the second quarter of 2020, the Chinese economy grew by 3.2% YoY after reporting a record 6.8% contraction in Q1. Although many analysts initially expressed growth concerns due to the pandemic's effects, China's economic fundamentals have improved considerably over the past several weeks.
With all that in mind, here are two exchange-traded funds that are worth considering for long-term portfolios.
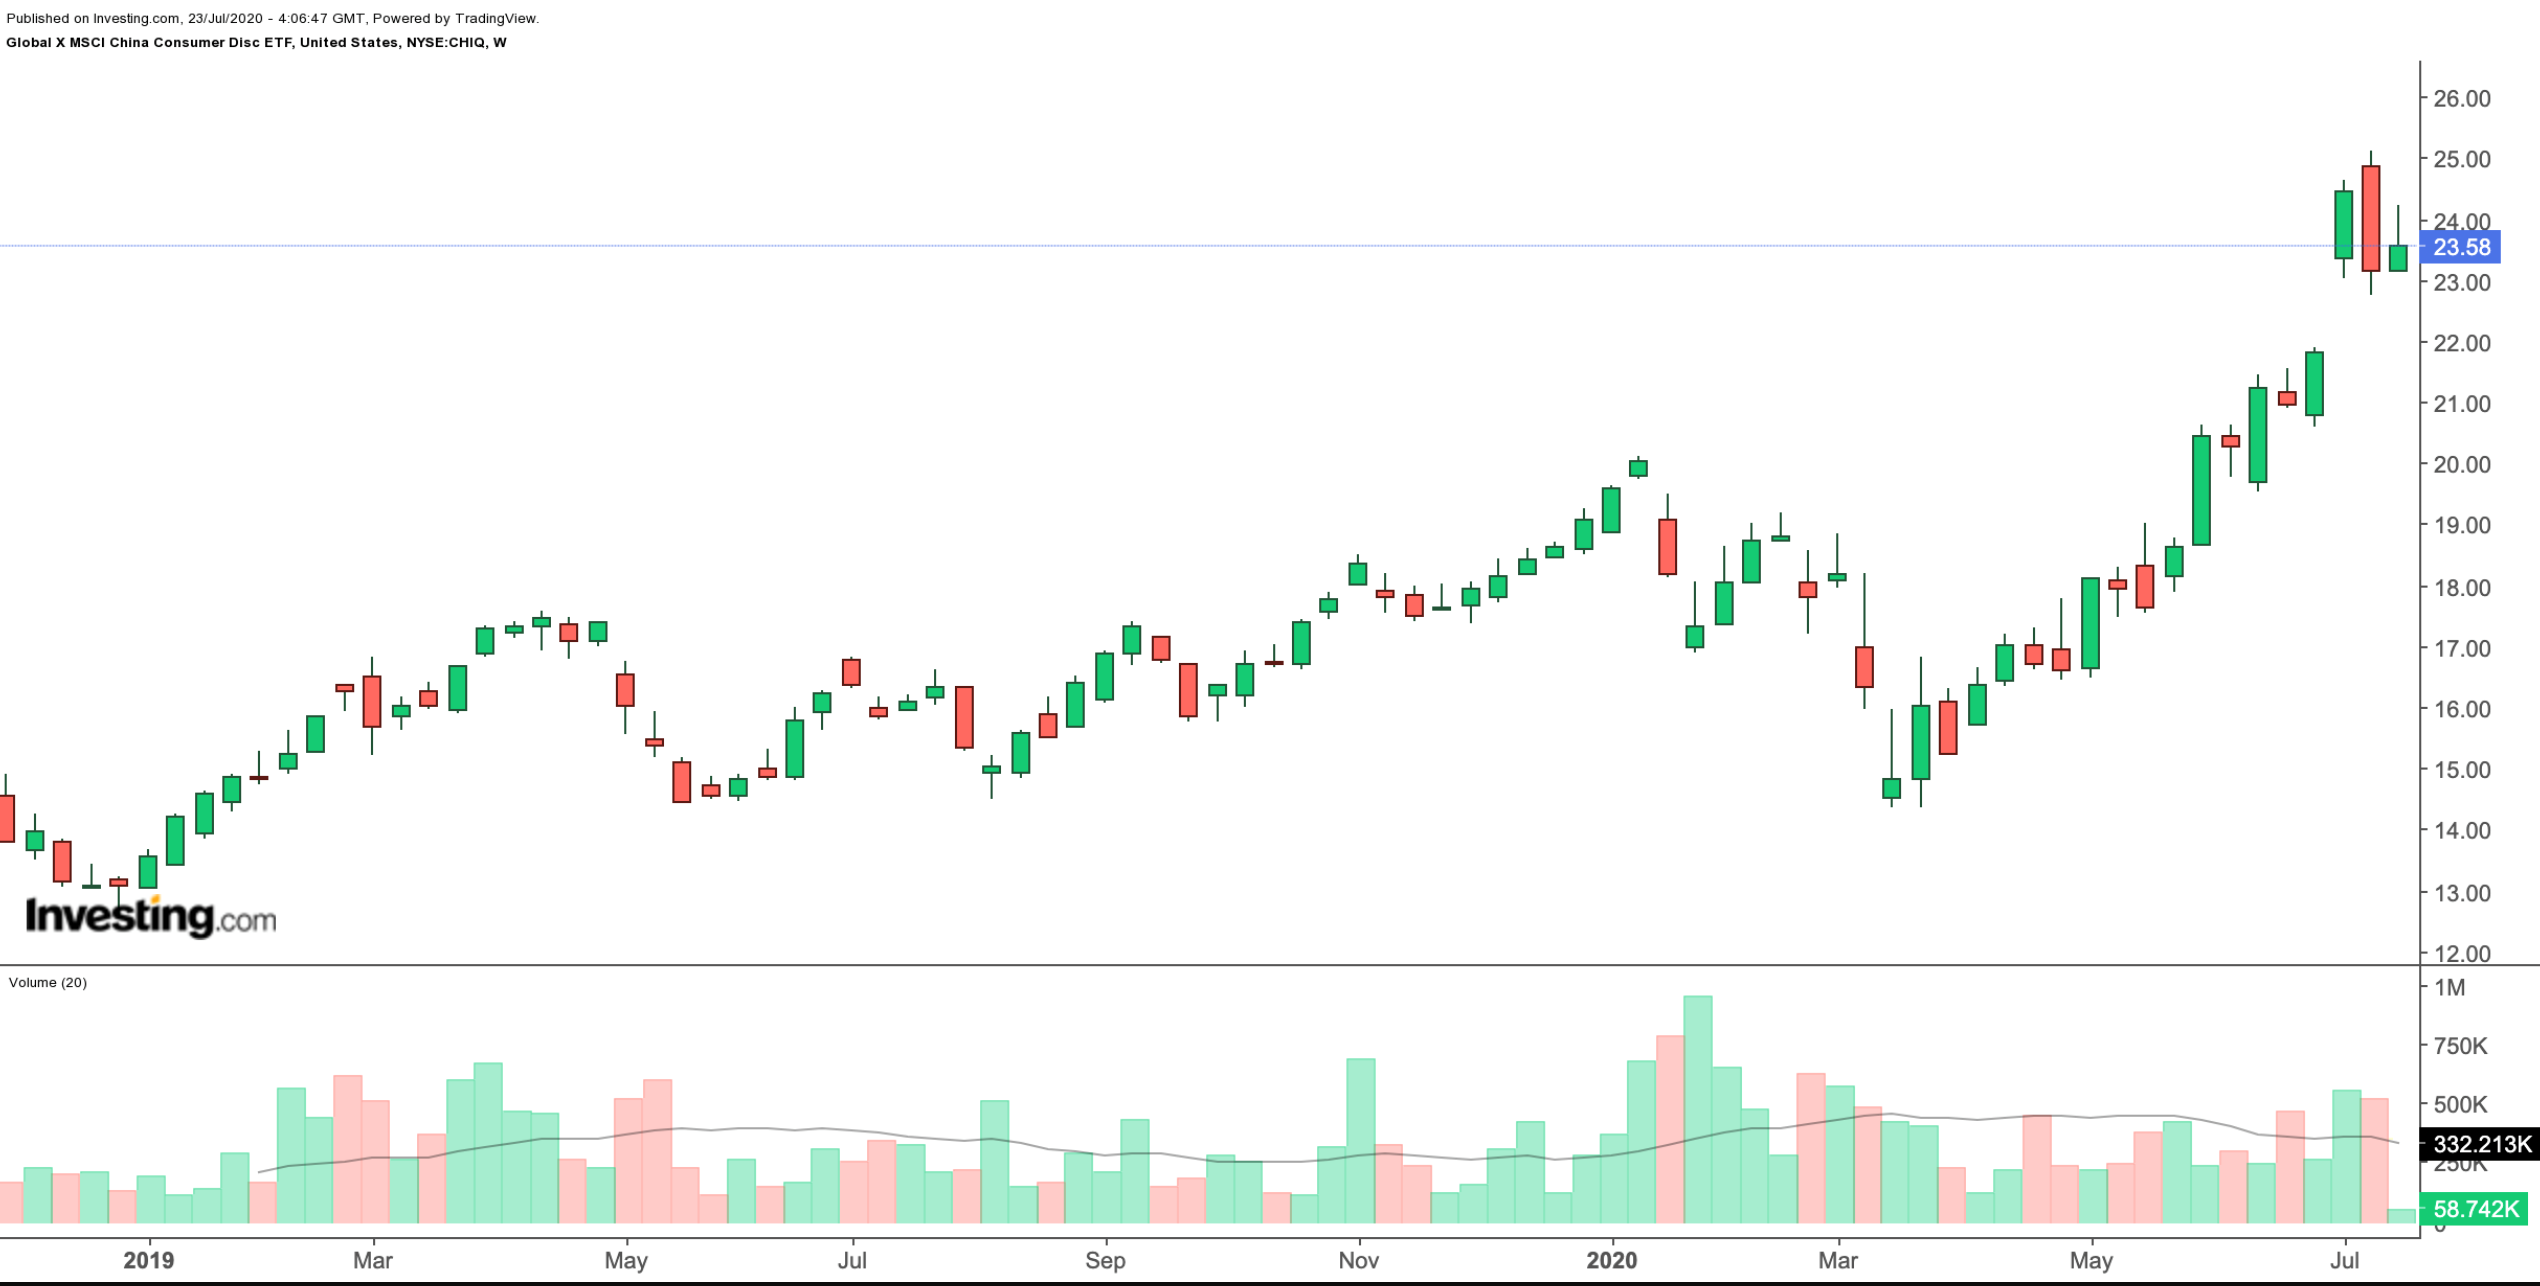
1.Global X MSCI China Consumer Discretionary ETF
- Current Price: $23.58
- 52-week range: $14.35-$25.11
- Dividend Yield: 0.67%
- Expense Ratio: 0.65% per year, or $65 on a $10,000 investment.
The Global X MSCI China Consumer Disc ETF (NYSE:CHIQ) invests in 68 large- and mid-cap Chinese consumer companies. The top five sectors are Internet & Direct Marketing Retail Automobiles, Diversified Consumer Services, Hotels, Restaurants & Leisure, and Textiles, Apparel & Luxury Goods.
CHIQ tracks the MSCI China Consumer Discretionary 10/50 index, whose top five holdings include Meituan Dianping (OTC:MPNGF), JD.com (NASDAQ:JD), Alibaba (NYSE:BABA), TAL Education Group (NYSE:TAL), and NIO (NYSE:NIO), accounting for almost 40% of assets under management.

The fund distributes dividends to stockholders semi-annually. YTD, CHIQ is up around 27.5%, meaning it’s in a bull market. Potential investors may consider buying the dips, especially if the price goes toward $21 or below
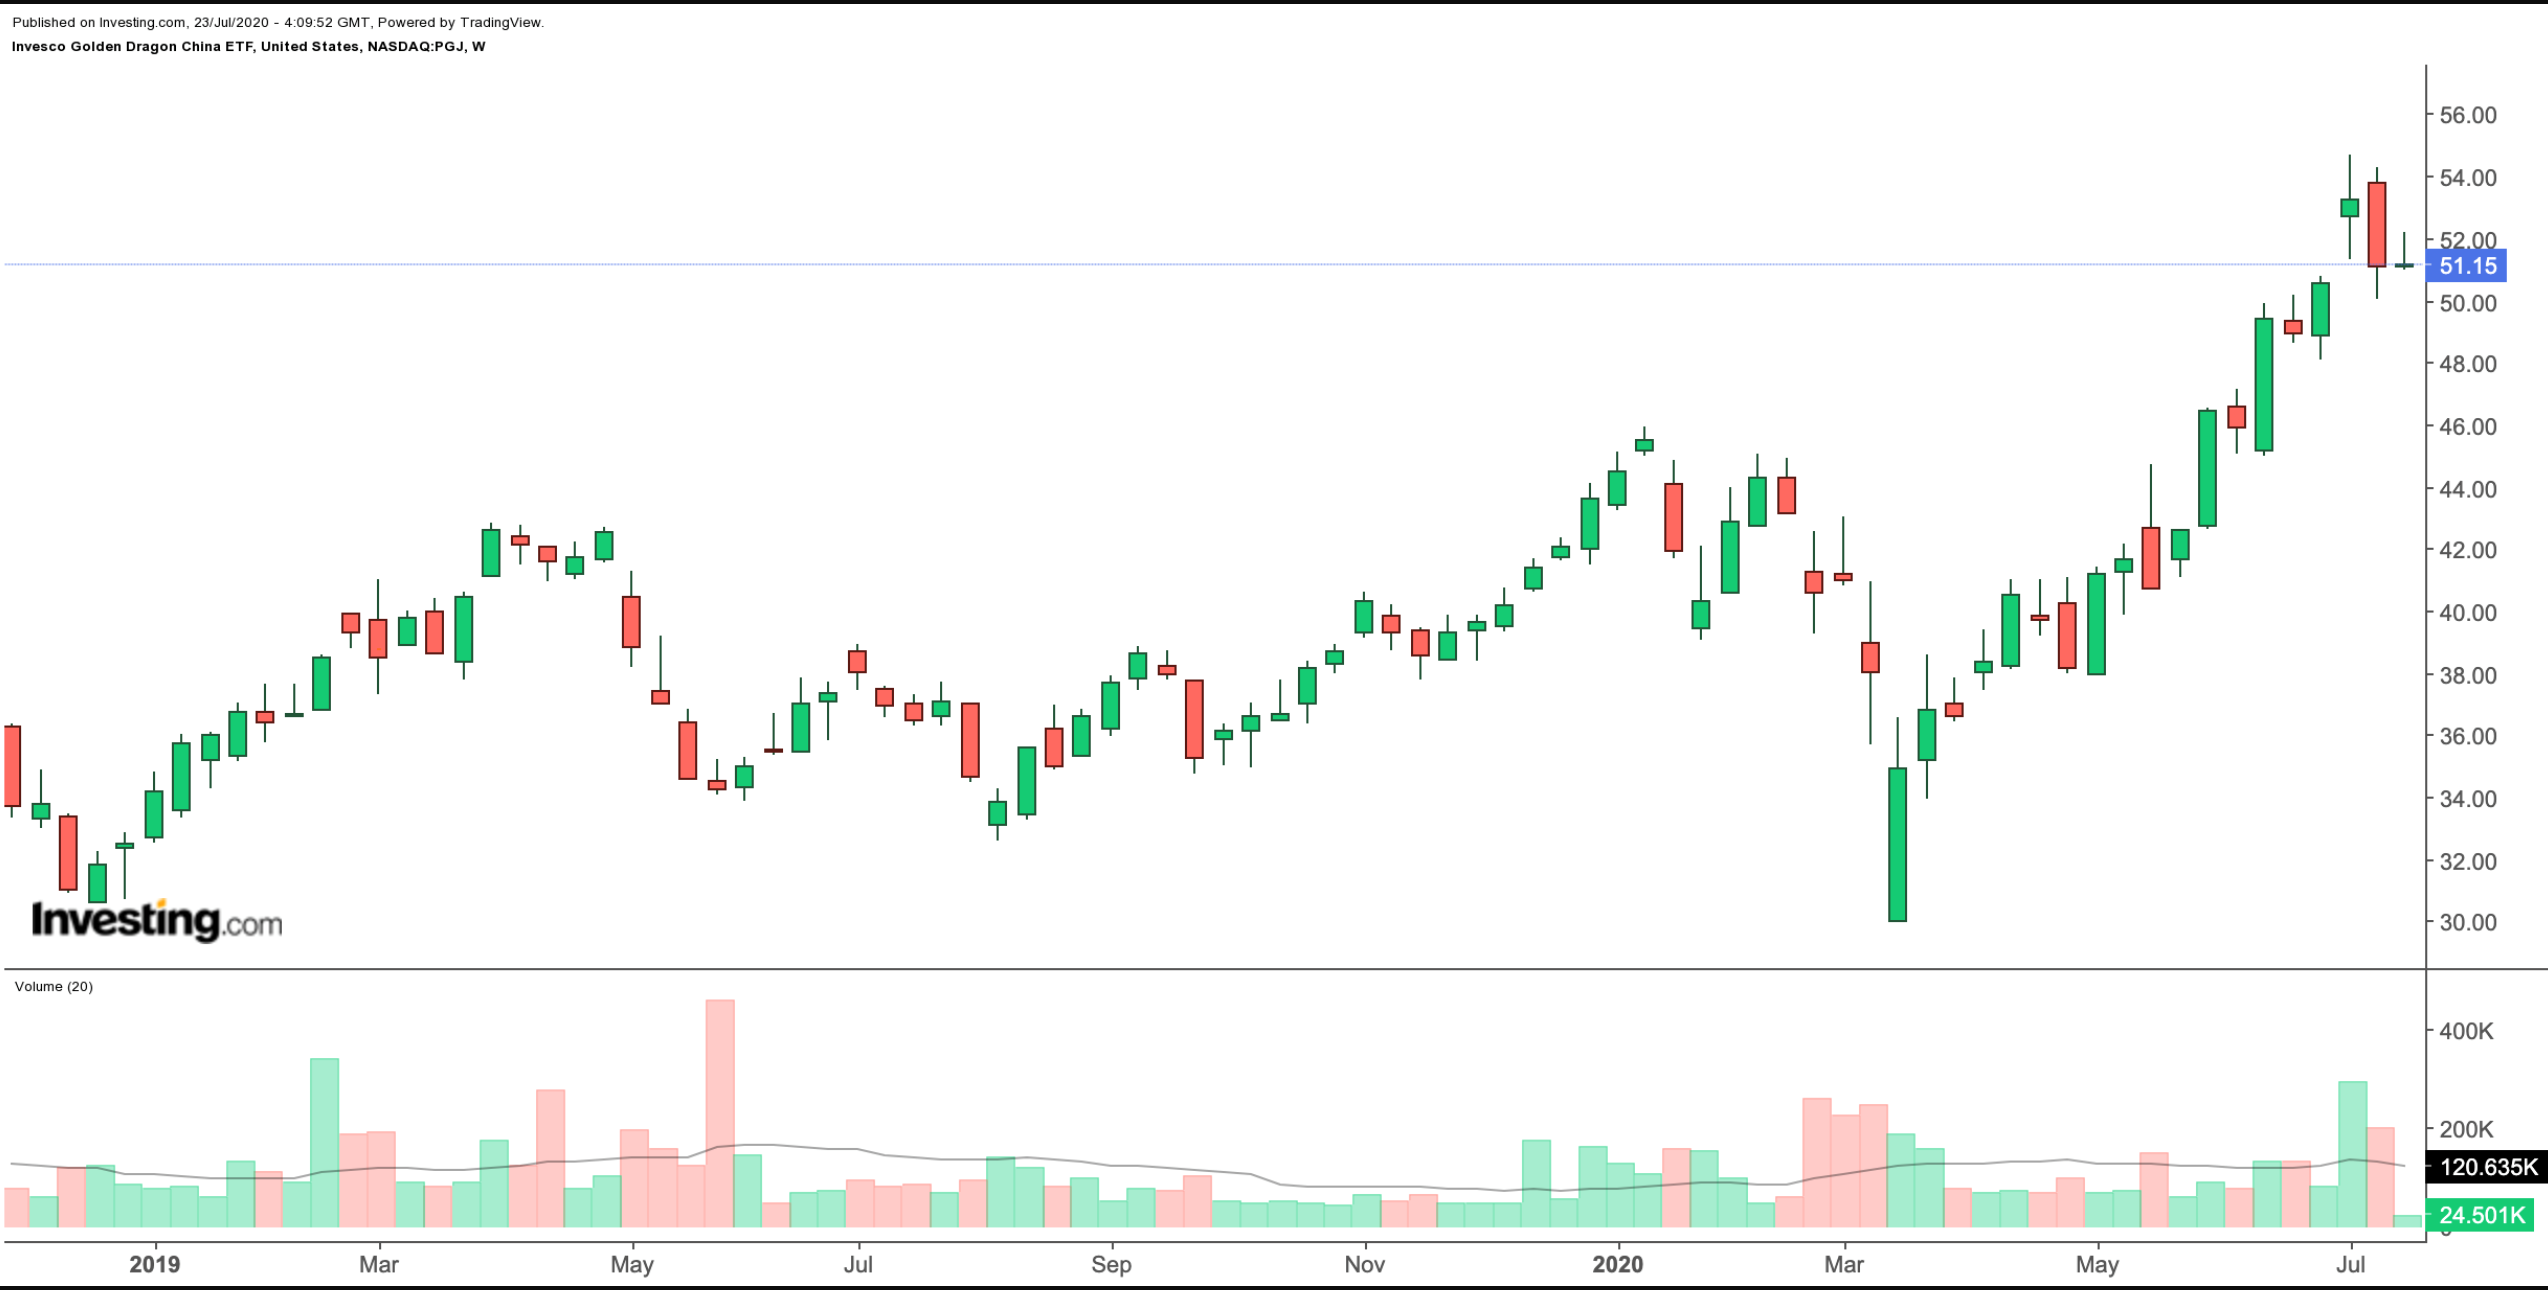
2. Invesco Golden Dragon China ETF
- Current Price: $51.15
- 52-week range: $30-$54.67
- Dividend Yield: 0.25%
- Expense Ratio: 0.70% per year, or $65 on a $10,000 investment.
The Invesco Golden Dragon China ETF (NASDAQ:PGJ) invests at least 90% of its total assets in equity securities of companies deriving a majority of their revenues from China. PGJ is based on the NASDAQ Golden Dragon China index.
The fund, composed of US exchange-listed companies that are headquartered or incorporated in China, includes 63 holdings operating in various sectors in China. The top five holdings are TAL Education Group, Baidu (NASDAQ:BIDU), NetEase (NASDAQ:NTES), JD.com, and Alibaba, which account for close to 40% of PGJ,

So far in 2020, PGJ is up 23%. As the current earnings season in the US rolls on, there may be some short-term profit-taking in the shares that make up the fund. A move toward $48 is likely.
Bottom Line
Given that China is the most populous country in the world, we can expect its economy to show resilience long-term despite occasional hiccups. ETFs offer opportunities to invest in the growing Chinese consumer, e-commerce and technology segments.
