- More companies warn of profit losses
- S&P 500 completes bearish pattern typical of the rally in a bear market
- Oil achieves first weekly gain in a month
- Employment data will be in focus this week
Equities in Europe and the US—including for the Dow Jones, S&P 500, NASDAQ and Russell 2000—all slumped on Friday, as guidance for upcoming quarters from domestic and multi-national companies continued to auger poorly for future corporate results and the global economy. Along with the still-spreading coronavirus, and the possibility of a renewal in the US-China trade war, these factors point to an increase in market volatility during the coming trading week.
Though the number of new cases of COVID-19 have slowed in some regions, with more than 3,441,000 cases reported around the world and more than 67,000 fatalities in the US alone, the pandemic's impact is far from over. Plus, President Donald Trump's effort to not just cast blame on China for the viral outbreak, but to raise tariffs as a way of "retaliating," is likely to fuel risk-off market sentiment and drive possible wild market swings.
Period Of Emotional Trading
The S&P 500 Index dropped 2.8% on Friday, after grim profit warnings from two of the economy’s bellwethers—Apple (NASDAQ:AAPL) and Amazon (NASDAQ:AMZN)—reversed the benchmark's weekly gain, turning it into a 0.2% loss at the close.
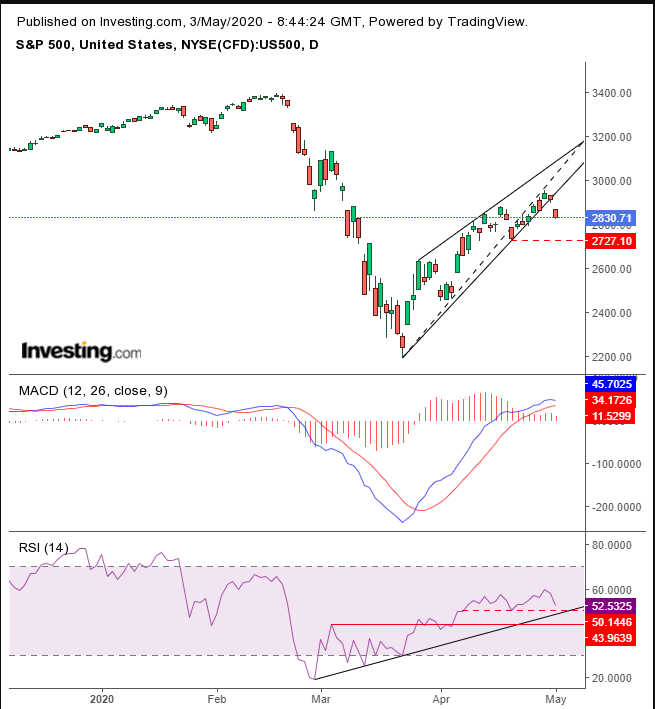
In addition, the S&P 500 just completed a rising wedge. On April 23 we said the benchmark may have completed this pattern, according to the dotted line, but instead it made a new high. Nevertheless, in both instances, the index dropped around 3%, demonstrating a tilt in the supply-demand balance in favor of bears. We expect full confirmation when the price falls below the April 21 low at 2727.10, by which time the MACD and RSI will themselves top out, showing a decline over a broad range of prices and momentum.
Rising wedges are common—especially as the first leg up after entering a bear market. If we use an arbitrary Wall Street metric for guidance—a 20% rise from the previous low—we’re in a bull market. However, as the term 'arbitrary' implies, it doesn’t concern itself with other salient factors such as the economy, nor with human intuition that takes into account a bigger picture, such as the fact that there has never been a bear market as short as three weeks, which preceded this new bull, nor anything close to it.
Indeed, on April 7, we wrote:
“From a technical perspective, the S&P 500 just completed a short-term uptrend within the long-term downtrend.”
We now wish to retract that call, of a downtrend in the long-term. We were overly focused on the monumental, 35% freefall from the Feb. 17 peak to the March 23 low. After taking a deep breath and a step back, we reminded ourselves that rather, we’re in a sideways move since January 2018, while maintaining a long-term uptrend since the March 2009 low.
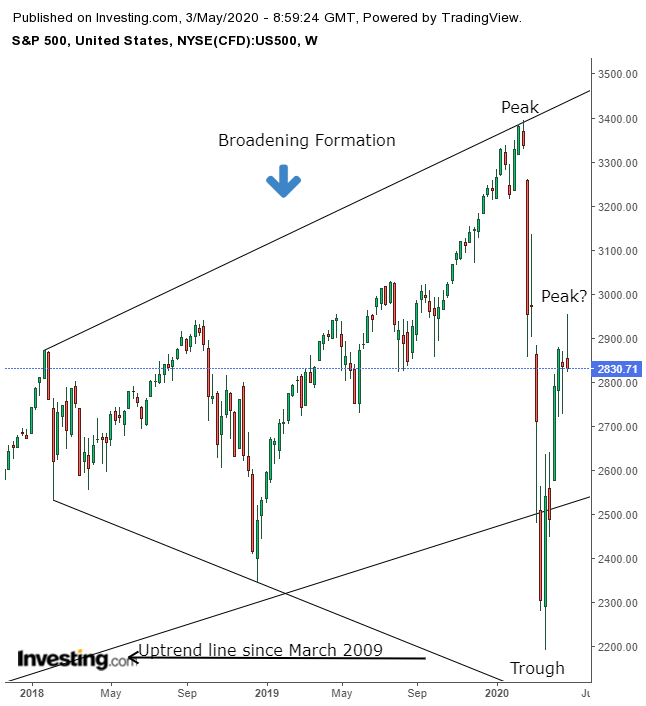
As such, only after a new low, below the March 23, 2,191.86 trough, will we be in a long-term downtrend. On the other hand, only after a new high above the 3,393.52 peak, will we be in a long-term uptrend.
Meanwhile, as we’ve noted many times, the price has been developing a broadening formation since January 2018. This pattern is only found at a market top.
The reason it does not develop at market bottoms: it's the result of very emotional trading, especially by retail traders, the unprofessional public, sometimes referred to as “dumb money.” Since that psychology does not follow a sharp decline, it could not appear there.
Are we in a period of extremely emotional trading? Certainly. However, it’s important to note that this very bearish pattern generally takes months to play out, yet this one is already potentially over. Will the dynamic that has dominated the broadening formation over a few months, emotional trading compressed into a brief period, carry over into a full year or more, when a different set of narratives dominate the market? We don’t know.
Is this past April, the S&P 500’s best month since 1987 a sign that good times are ahead, or is it simply the last spark before the candle flickers out? We've already laid out our technical position above. From a fundamental perspective, traders will have to decide whether they believe that unprecedented and unlimited stimulus can create an alternative economy. In our view, earnings and data weigh in with a resounding “no.”
One interesting tidbit. Legendary investor Warren Buffet (NYSE:BRKa) is sitting on a mountain of cash, to the tune of $137 billion dollars, not withstanding that the broader sell-off hit his company's vast holdings significantly in Q1, the Oracle of Omaha is still ahead. Enough said.
Amazon’s CEO Jeff Bezos told shareholders to “take a seat,” as the coronavirus crisis eats into profits as it looks after its employees. The e-tail behemoth will spend all of its $4 billion plus operating profits on protection against COVID-19—a brilliant long-term move that's so clever we think it looks Machiavellian: the company cares about its workers, which is great PR, but it’s also practical, as healthy employees will allow the company to keep running smoothly after an unprecedented hiring spree of 175,000 during a time when more than 30 million Americans have lost their jobs.
Still, some investors were not impressed. The stock fell 7.6% on Friday.
If traders weren’t thrilled with Amazon’s guidance around spending all operating profits on coronavirus-related expenses, they certainly weren’t crazy about Apple’s total lack of forward guidance. The company said it was not willing to set a target for near-term future quarters amid all the pandemic uncertainty.
This is the first time in ten years that the iPhone maker wouldn’t provide a forecast. Shares sold off 2.7% during Friday trade. However, by promising to continue buybacks and raise its dividend, Apple managed to offset what would have likely been a far steeper drop. Plenty of other companies have had to either suspended or cut dividends in April while stopping buybacks completely.
Oil super-major Exxon Mobil (NYSE:XOM) plunged 7.2% on Friday after reporting the company's first quarterly loss in more than 30 years, a result of crumbling oil demand and the collapse of crude prices.
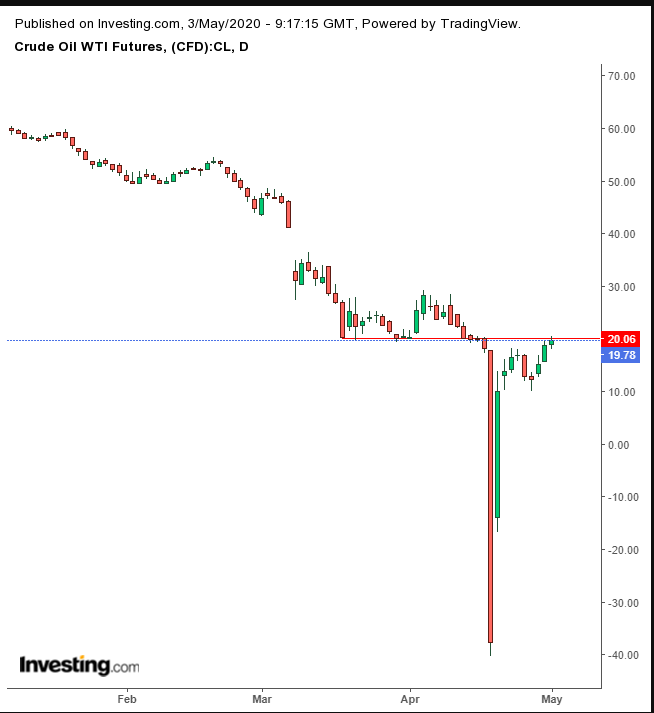
WTI oil posted its first weekly gain in about a month, but closed at $19.78, right below our $20.00 red line, making it an ideal short position, at least from a risk-reward perspective.
The dollar fell on Friday, along with yields, including for the benchmark 10-year Treasury. It was the sixth straight day declines for the Dollar Index.
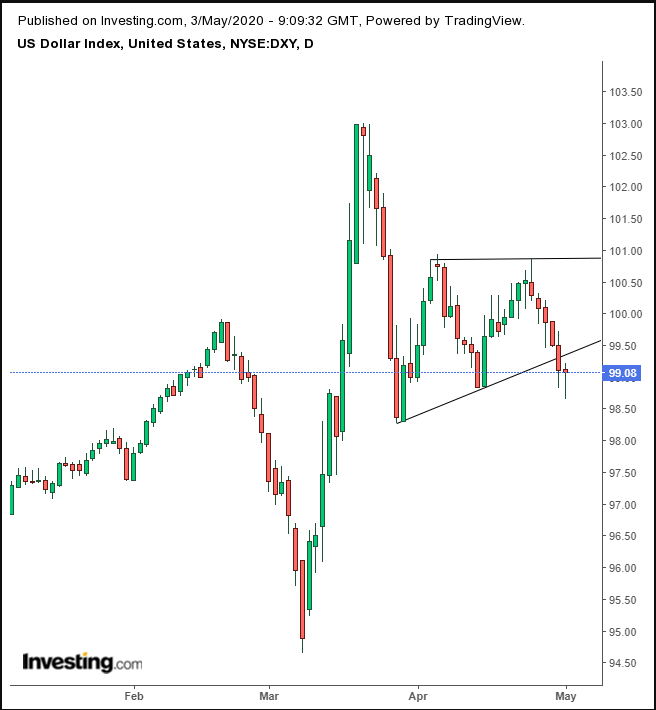
Technically, the greenback has been moving sideways, as investors can’t make up their minds. Case in point, the dollar developed an ascending triangle, whose rising demand line overtook its supply line providing a bullish view.
However, this pattern should appear during a rally, although this one interrupted a decline. This counterintuitive move resulted in a downside breakout, demonstrating that the supply-demand balance shifted in the medium term.
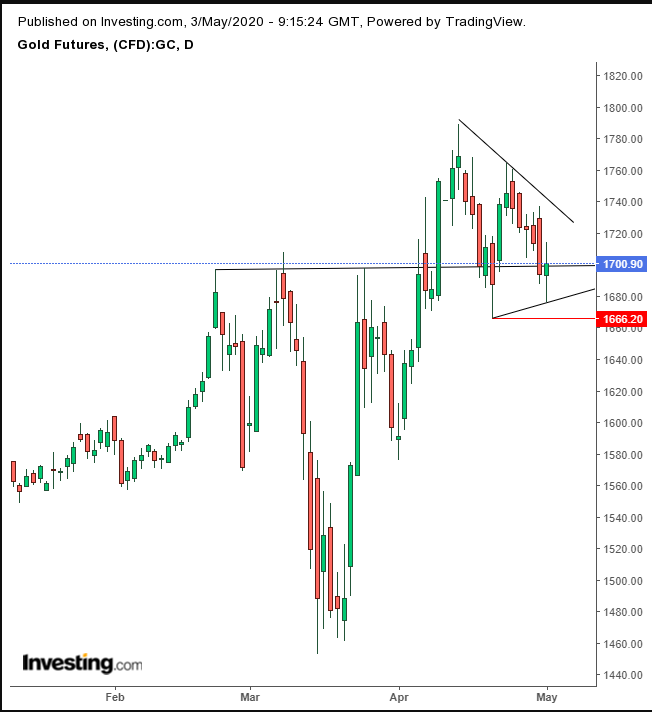
Gold developed a high wave candle, considered bullish after a decline, especially when forming at the support of a H&S continuation’s neckline. However, the lower high posted on April 23, from the initial breakout on April 14 has us concerned of a possible pattern failure. Note, the counter-intuitive nature of the lower low to the dollar’s out of character pattern development in the chart above.
If the price of gold finds support by the $1,680 level it would be developing a pennant (generally takes up to a month) or an ascending triangle (longer than a month)—both are considered continuation patterns, and thus bullish after the preceding rise. If gold falls below $1,666, we’d consider the H&S pattern a failure, suggesting gold would then plummet toward $1,450.
The Week Ahead
All times listed are EDT
Sunday
21:45: China – Caixin Manufacturing PMI: expected to remain relatively flat, staying within expansion territory, at 50.3, up from 50.1.
Monday
3:55: Germany – Manufacturing PMI: anticipated to plunge to 34.4 from 45.4.
Tuesday
4:30: UK – Construction PMI: seen to rise to 44.0 from 39.3.
4:30: UK – Services PMI: likely to have plummeted to 12.3 from 34.5.
10:00: US – ISM Non-Manufacturing PMI: forecast to fall to 44.0 from 52.5.
Wednesday
5:00: Eurozone – Retail Sales: expected to have tumbled to -10.5% in March from 0.9% previously.
8:15: US – ADP Nonfarm Employment Change: seen to decline to -20,000K from 27,000K.
10:30: US – Crude Oil Inventories: likely to soar to 10.619M from 8.991M.
Thursday
7:00: UK – BoE Inflation Report, MPC Meeting Minutes
8:30: US – Initial Jobless Claims: last week, an additional 3,839K people lost their jobs, bringing the current US total up to 30 million...and counting.
Friday
8:30: US – Nonfarm Payrolls: one of the most closely watched releases of the month is forecast to surge to -21,000 from -701,000.
8:30: US – Unemployment Rate: anticipated to jump to 16.0% from 4.4%
