- Extended stimulus deadline keeps hope alive
- Treasury selloff weakens dollar, boosts gold
Key Events
US futures, including the Dow, S&P 500, NASDAQ and Russell 2000, climbed on Monday with global stocks, boosted by optimism that there will be a successful vaccine for COVID-19 before the year is out. However, disappointing Chinese economic data has offset some of the gains.
Global Financial Affairs
S&P 500 futures advanced in pre-New York open trade, building on the third straight weekly gain after Congressional House Speaker Nancy Pelosi extended the deadline for a stimulus deal to Tuesday, following intensive talks with Treasury Secretary Steven Mnuchin.
In Europe, the Stoxx 600 index gained with the insurance and banking sector, while energy and healthcare underperformed.
Stocks in Asia climbed back to a two-and-a-half year high, the MSCI All Country Asia Pacific ex Japan added 0.22%, gaining for its second trading day in a row. However, it was held back by Chinese GDP data—after recent positive economic news, the world's largest economy reported GDP below expectations.
All in all, the benchmark is up for eight of the last ten trading days, a rally spurred by ongoing optimism about a potential virus vaccine and the expectation that US Democrats will gain control of all three houses: the White House, Congress and the Senate – forming a “blue wave in the Nov. 3 elections. The potential of a single party government, which would be able to function effectively, increases certainty and therefore investor confidence.
Three themes were driving markets last week: stimulus, vaccine hopes and economic news. Pfizer (NYSE:PFE) said that it will request emergency FDA approval in late-November for the COVID-19 vaccine it is developing, assuming its current trials yield positive results.
Bears have two main concerns. Persistently rising COVID cases means there is a threat of further restrictions which will choke economies, and stalemate in negotiations in the US.
These fears took control of the market on Monday, when the S&P 500 index traded just one percent from its Sept. 2 record. The market sold off for four straight days, its longest losing streak since March when the benchmark fell in the fastest bear market in history.
Meanwhile, bulls focused on encouraging US economic data which signaled some resilience to the economic recovery. Retail sales provided a bright spot, while jobless claims were higher than expected and job growth showed signs of weakening. Consumer spending is extremely important for a developed economy, as it accounts for approximately two thirds of its GDP.
Swings in the S&P index last week are the typical dynamics of an intense exchange between bulls and bulls. There is no mistake, I mean bulls and bulls.
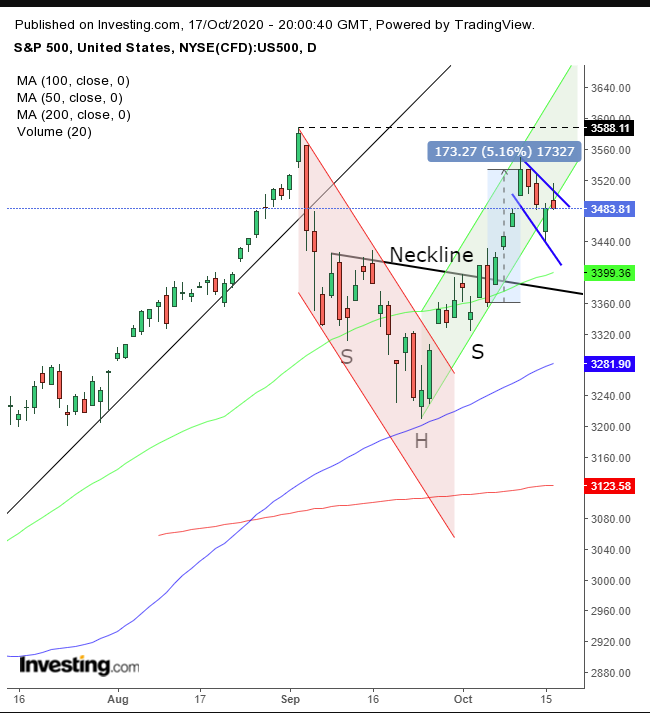
The benchmark developed a falling flag. Intuitively, it can appear as a bearish pattern because it falls. However, it is the formation of a bullish structure, and here’s why:
- Bulls enjoyed four straight days of gains—a 5% increase from Oct. 7 to Oct. 12
- That is a significant profit in a short time which many wanted to crystalize.
- This means they sold their positions, which reduced demand and increased supply.
- That pushed the price down, which is why the flag is “falling
- However—and this is a big however—there was no demand for the stocks that the early bulls were unloading, so stocks fall sharply, rather than congest in a downward fashion.
In other words, there are new bulls picking up the stocks that the early bulls are selling off. Once the early bulls finish selling off their stocks, the supply would suddenly disappear and only demand would remain, making the stocks jump. Of course, this is not a prophecy, but the dynamics of a falling flag.
If there will be an upside breakout it will signal that all available supply has dried up and buyers are forced to raise their bids to find new willing sellers, pushing prices higher.
Mapping The Chart
In technical analysis, often the location of a pattern on the chart gives it special meaning since the art and science of technical analysis is recognizing where supply and demand are hiding in the chart.
The flag is considered the midpoint of a move. The first was the upside breakout of a H&S bottom—when a downtrend (red) turns into an uptrend (green). If the flag follows through, the second move would be taking on the all-time high, registered on Sept. 2 (dotted line).
Yields rose for the fourth straight day, as investors dump bonds in favor of risk assets. The Treasury selloff pushed the dollar down for the second session in a row.
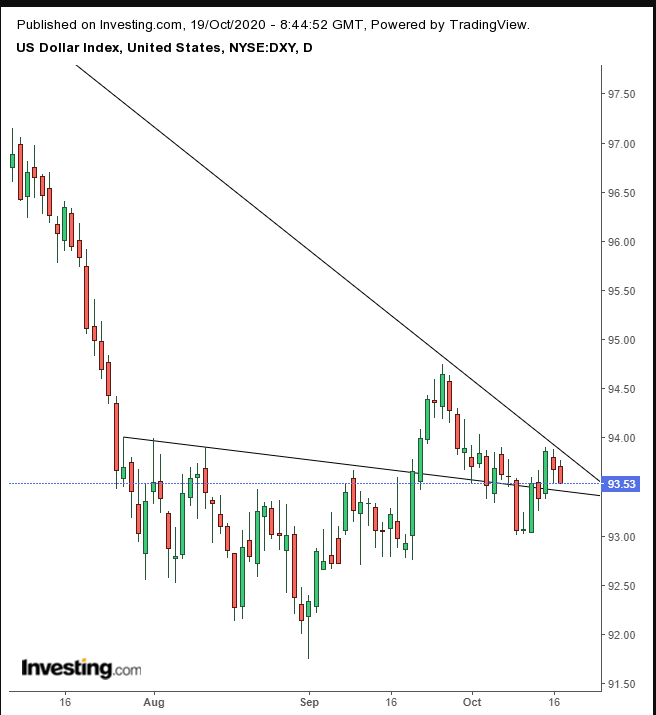
The dollar bulls and bears struggle to dominate their trends. The bottom and its neckline represent demand, while the downtrend line since the March high manifests supply.
Gold advanced to a weekly high on dollar weakness.
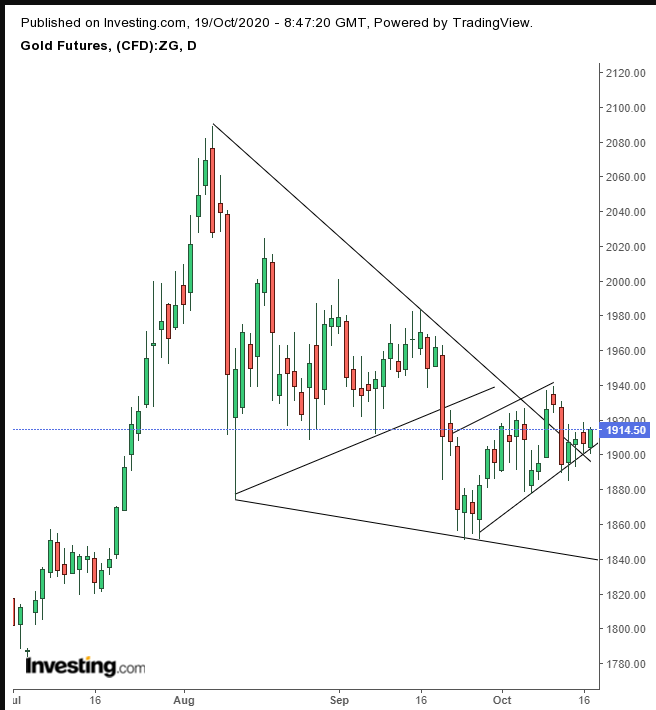
Supply and demand remain at an impasse, as the price struggles between its rising flag, bearish after the symmetrical triangle and the larger, falling wedge, bullish after the 15% surge that preceded it.
Bitcoin declined but within a bullish pattern.
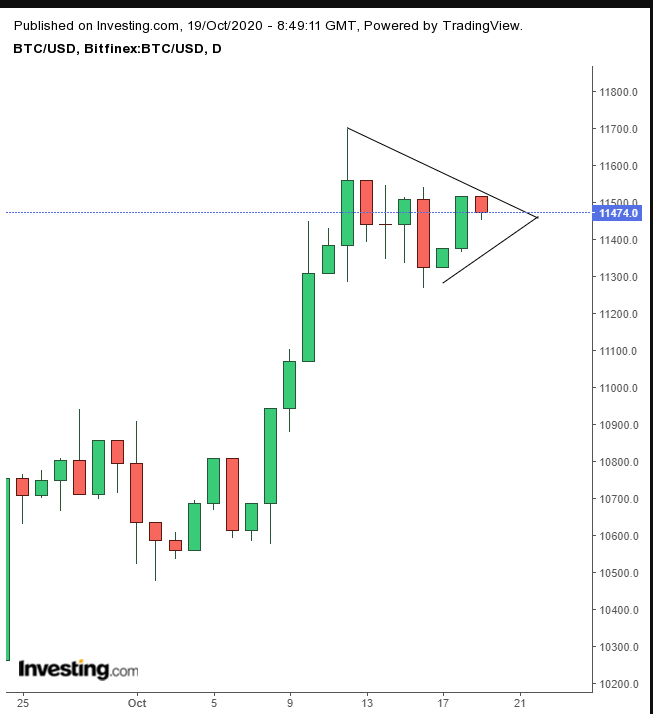
The price of bitcoin is at equilibrium for the seventh session, as new bulls pick up the digital currency from earlier bulls who enjoyed a hike of up to 10%.
Crude oil oscillated before the OPEC+ meeting.
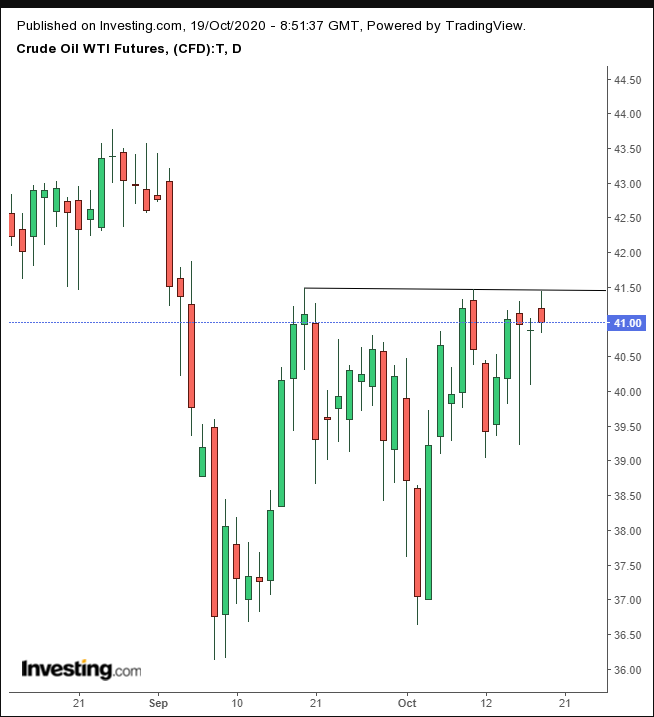
Technically, oil pared gains from the $41.50 level, where it has been rejected since Sept.18, two whole months.
The Week Ahead
All times are EDT
Monday
8:00: US – Fed Chair Powell Speaks
8:45: Eurozone – ECB President Lagarde Speaks
21:30: China – PBoC Loan Prime Rate
Tuesday
8:30: US – Building Permits: seen to be 1.505M from 1.476M
Wednesday
2:00: U.K. – CPI: expected to rise to 0.5% from 0.2%
3:30: Eurozone – ECB Presidet Lagarde Speaks
8:30: Canada – Core CPI
8:30: Canada – Core Retail Sales: forecast to climb to 0.9% from -0.4%
10:30 – Crude oil inventories: to advance to -2.835M from -3.818M
Thursday
5:25: U.K. – BoE Governor Bailey Speaks
8:30: US – Existing Home Sales: forecast to rise to 6.30M from 6.00M
Friday
2:00: U.K. – Retail Sales: to recede to 0.4% from 0.8%
3:30: German – Manufacturing PMI: expected to step back to 55.1 from 56.4
4:30: U.K. – Manufacturing PMI: seen to edge up to 54.3 from 54.1
4:30: U.K. – Services PMI: to decline to 55.0 from 56.1
6:30: Russia – Central Bank of Russian Federation Interest Rate Decision: consensus keeps rates unchanged at 4.25%
