Ethereum price target raised at Standard Chartered. Here’s the new forecast
- Bank earnings beats set up high bars for other, non-financial sector companies
- Experts will continue to argue about the meaning and significance of inflation, but markets will whipsaw
- Yields and the dollar are already falling, boosting gold, but we expect that to be a short-term event
- Bitcoin failed to keep record gains, developing bearish pattern
The much heralded Reflation Trade provided a boost to both Friday's trading and the full equity market rally last week. Similar sentiment is likely to prevail into the upcoming trading week.
All four major US indices—the S&P 500, Dow Jones, NASDAQ and Russell 2000—were buoyed by positive economic data during the course of the week, which lifted benchmarks to back-to-back all-time highs. The news was so bullish that bonds and commodities also rallied.
Long-Term Inflation Or A Return To The Mean?
The Dow shot past the 34,000 threshold for the first time, and the S&P 500 Index closed higher for the fourth week in a row after China’s economy soared, +18.3% in the first quarter, as consumer spending beat expectations, putting the Asian nation on track to join its bigger economic rival, the US, in leading the rest of the world into an economic recovery. This may be an appropriate time to note though, that this growth is in comparison to a year ago, when the global economy was shut down as the spread of COVID-19 became a pandemic.
China’s data on Friday built on a series of strong US releases last week including CPI, Crude Inventories, Initial Jobless Claims and Retail Sales. All of which propelled the MSCI All-Country World Equity Index to a record high.
In the US on Friday, the Materials (+1.2%) and Utilities (+0.8%) sectors gained the most, while Technology (-0.02%) and Communications Services (-0.1%) were in red.
For the week, value sectors such as Utilities (+3.7%) and Materials (+3%) led, while growth sectors Tech (+1.1%) and Communication Services (-0.1%) lagged with Communications the sole sector in the red.
We have often made comparisons between the NASDAQ 100—representing growth stocks that were the biggest beneficiaries from the stay-at-home pandemic environment—and the Russell 2000, whose domestic firms—representing value stocks which lost the most business during lockdowns—stand to gain the most from a reopening economy. While the NASDAQ 100 formed a hammer, bearish if Monday’s candle closes below the real body of Friday’s candle (open-to-close, excluding intraday highs and lows), the Russell 2000 continues along a potential top.
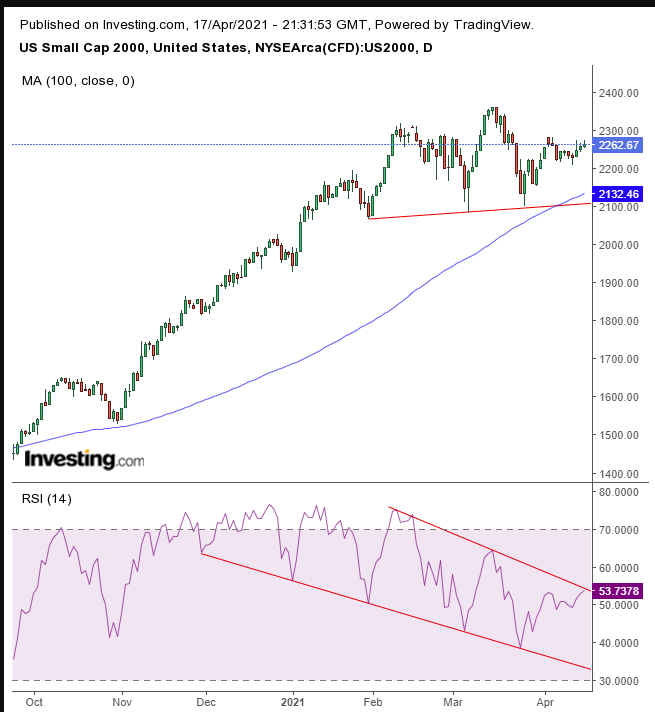
The small cap index is potentially forming the right shoulder of a H&S top, as its RSI is testing the top of its falling channel, drawing a negative divergence between momentum and price.
A combination of the arrival of stimulus checks and easing restrictions provided the breeding ground for US retail sales to soar 9.8% MoM in March. The release more than topped estimates to score the second-fastest growth on that metric in 30 years. But is it sustainable?
Though the most recent shopping spree took place after the distribution of the country's third round of 'helicopter money,' presumably there's more where that came from, given the two previous rounds of government fiscal aid, nearly doubled the American personal savings rate, measured versus before the virus. The hope is that a reopening economy along with a higher employment rate and better pay will encourage people to resume spending after they'd been holding back for so long.
As for inflation, the jury is still out. Last week's consumer price release was keenly watched. It rose 0.6% on a MoM basis and 2.6% YoY, the biggest advance since 2008. It’s a matter of contention, however, among economists, what should be included in the CPI measure in order to fairly reflect economic reality.
Energy prices are included in the non-core metric which means gasoline prices—which jumped YoY—are having a disproportionate impact on the measure right now. In comparison, core CPI, which excludes volatile food and energy prices, increased only 1.6% YoY, (though the MoM figure was higher), marginally beating expectations.
This is where it gets especially tricky when trying to make sense of the inflation roadmap. Though it's true that inflation readings have accelerated when compared to the figures from a year ago, it's important to keep in mind that those figures were released after the economy had been shut down during the height of the contagion. That, naturally, some might even say 'artificially' pushed prices lower.
An additional development regarding rates: long-dated Treasuries, including the benchmark 10-year note, declined during the past week, despite rising inflation. That suggests elevated inflation was already priced in.
Perhaps too, it shows lingering faith by investors that the Fed will make good on its promises to keep rates lower for longer.
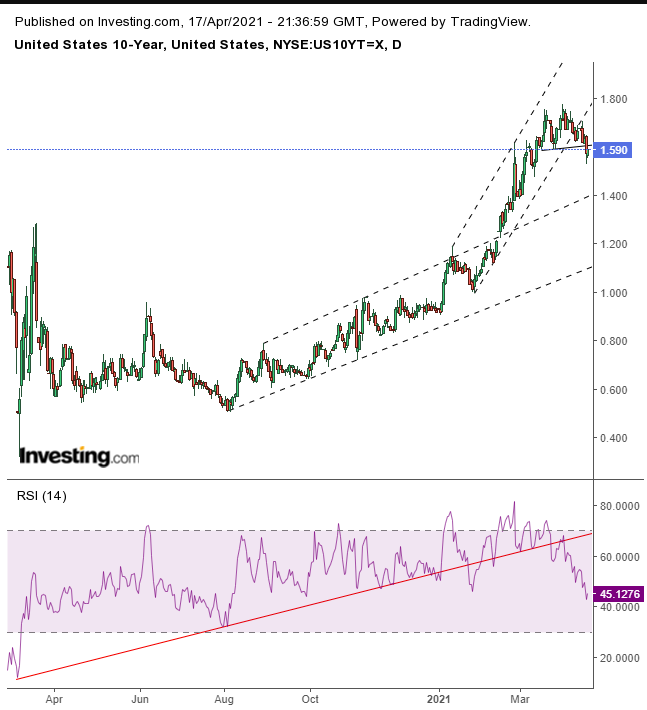
Yields have topped out, after the RSI fell below its uptrend line in late March.
Here's the key question for which we still don't have an answer: after prices rose from last year's lows, and with companies probably passing on the higher cost of production to consumers, will prices become locked into an uptrend, which create a long-term inflation problem? Or will they level out as the economy reopens, ultimately returning to the mean?
Last week also saw the launch of Q1 2021 earnings season with banks out front, reporting their first quarter results. Lower credit costs—even as investors bet on rising rates which would fill bank coffers—and increased trading activity were a recipe for success, lifting profits for all 13 banks that reported, to well above consensus expectations. That pushed Financials higher, +20.1% YTD, making the sector second only to Energy over the same period.
We need to caution, though, that there's a potential psychological setup in play for this earnings season to be deemed a failure. After banks set a high bar, since they benefit from an optimum recovery environment, will other companies in different sectors that don’t have these rare catalysts for success be able to measure up?
According to FactSet, earnings growth for the first quarter is expected to be +24.5%, the highest YoY growth posted since the third quarter of 2018, which came in at +26.1% . FactSet’s forward earnings are now also better than 2019's peak level, higher by 3%. If history is a guide, earnings grew by an average of 83% following the last three recessions, even after returning to the prior peak (120% after the 1990-1991 consumer debt unwind, 70% after the tech bubble bust, and 60% after the Great Financial Crisis).
On the other hand, we are still contending with a global pandemic, which hasn't been resolved, and has recently been complicated by additional vaccine distribution challenges. Moreover, none of the previous recessions resulted in a total economic shutdown. So really, we’re entering uncharted territory.
While we don’t know whether the current rate of economic growth will indeed be sustainable, we’re pretty sure the market will provide ample price action, making it a target-rich environment for traders.
The dollar fell for a second week, for the first time since mid-February.
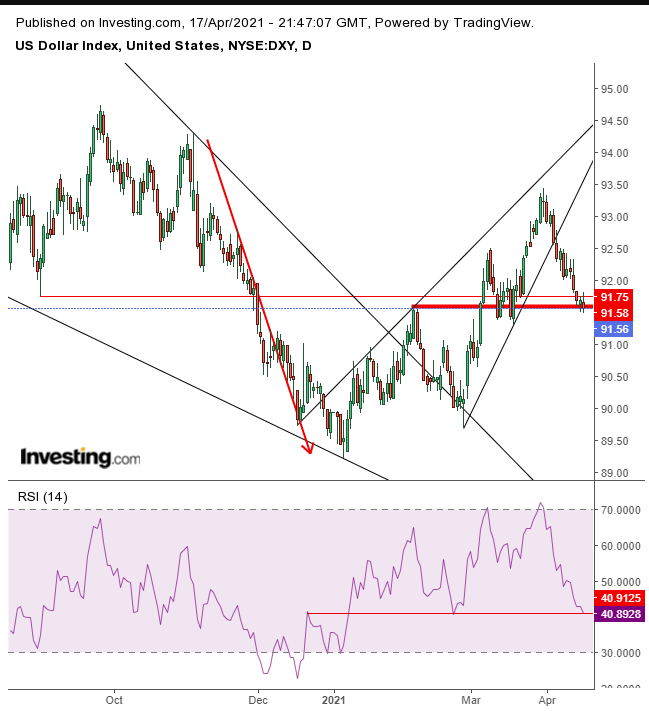
The greenback paused at the 91.50 area, as the bulls and bears that have been pushing the global reserve currency back and forth duke it out, until one group ends up exhausted and the other continues to propel the currency in their preferred direction. The chart illustrates that this price level has been attracting buyers and sellers since Feb. 4, and momentum has found this level as a support since breaking above this late December resistance to become a support in early January.
For now, the impetus seems to be on the side of the small rising wedge between February and April, which is bearish after the preceding plunge. However, we expect any decline now to be temporary, and expect the USD to jump back up, following the large falling wedge between March 2020 and February 2021. Only if the dollar takes out the 89 level, would we be inclined to return to our previous bearish posture.
Our most recent gold trade failed as the price blew out the bearish flag within the narrower, faster falling channel.
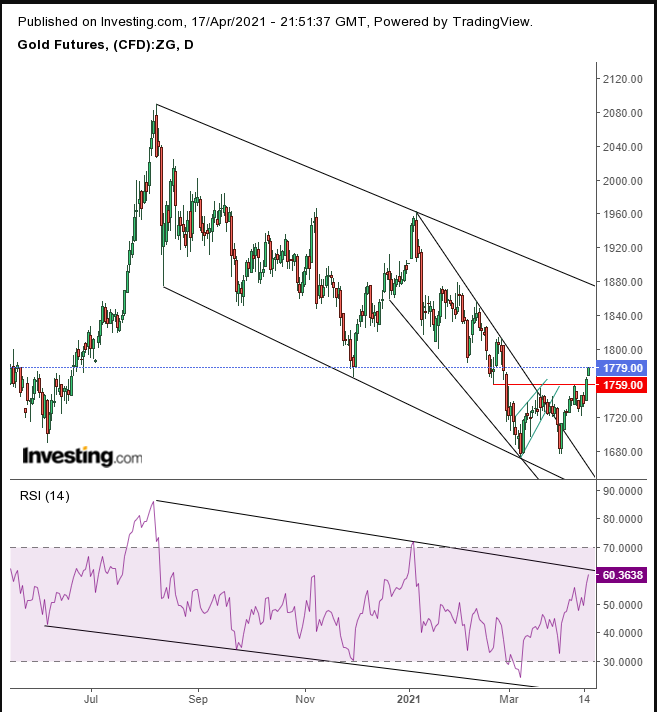
This created a double-bottom and pushed the price higher, now making its way to the top of the falling channel. The medium trend is still down, which makes a long position risky. Notice that the RSI is now testing the top of its own falling channel.
Though Bitcoin posted a new all-time high last week at $63,729.50, it's currently back under $60K.
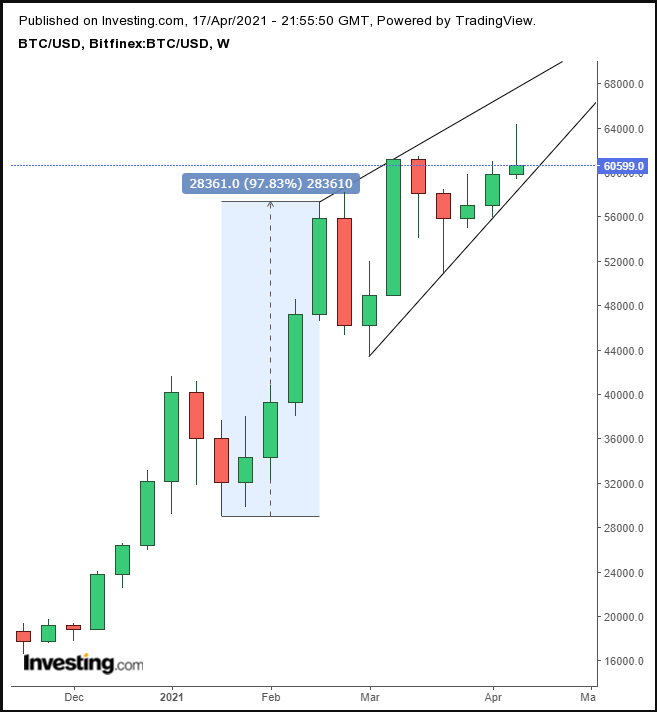
The most popular cryptocurrency by market cap trimmed its weekly advance, forming a weekly shooting star within a rising wedge, potentially bearish after the token's preceding climatic, near 100% rally within five weeks.
Though oil rose slightly last week, it finished down 0.60% on Friday.
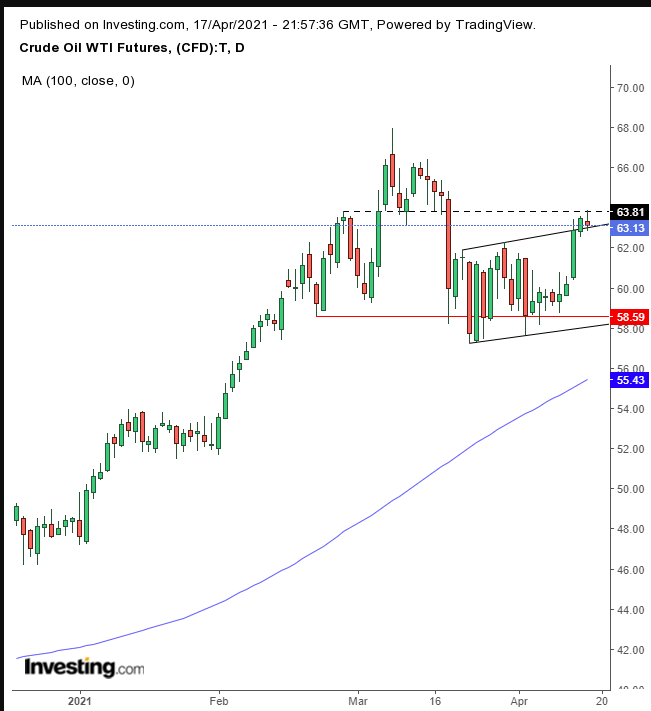
Crude barely pushed above its rising, and therefore bearish, flag, finding resistance by the right shoulder of a H&S top.
Week Ahead
All times listed are EDT
Monday
21:30: Australia – RBA Meeting Minutes
21:30: China – PBoC Loan Prime Rate: the central bank previously held the rate steady at 3.85%.
Tuesday
2:00: UK – Claimant Count Change: the March print came in at 86.6K.
Wednesday
2:00: UK – CPI: seen to nearly double in March to 0.7% from 0.4%.
6:30: UK – BoE Governor Bailey Speaks
8:30: Canada – CPI: anticipated to have moved to 0.6% in March, from 0.5% previously.
10:00: Canada – Interest Rate Decision: forecast to remain at 0.25%.
10:30: US – Crude Oil Inventories: last week's reading showed a drawdown of -5.889M bbls.
11:00: Canada – BoC Press Conference
Thursday
7:45: Eurozone – Deposit Facility Rate: expected to remain flat at -0.5%.
7:45: Eurozone – ECB Interest Rate Decision: seen to remain unchanged at 0%.
8:30: US – Initial Jobless Claims: predicted to rise to 625K from 576K.
8:30: Eurozone – ECB Press Conference
10:00: US – Existing Home Sales: likely to slip to 6.18M from 6.22M.
Friday
2:00: UK – Retail Sales: expected to fall to 1.5% from 2.1%.
3:30: Germany – Manufacturing PMI: anticipated to retreat to 65.9 from 66.6.
4:00: Eurozone – Composite PMI: forecast to drop to 52.8 from 53.2.
4:30: UK – Manufacturing PMI: previously printed at 58.9.
6:30: Russia – Interest Rate Decision: the central bank is forecast to raise rates to 4.75% from 4.5%.
10:00: US – New Home Sales: to jump to 885K from 775K.
Which stock should you buy in your very next trade?
With valuations skyrocketing in 2024, many investors are uneasy putting more money into stocks. Unsure where to invest next? Get access to our proven portfolios and discover high-potential opportunities.
In 2024 alone, ProPicks AI identified 2 stocks that surged over 150%, 4 additional stocks that leaped over 30%, and 3 more that climbed over 25%. That's an impressive track record.
With portfolios tailored for Dow stocks, S&P stocks, Tech stocks, and Mid Cap stocks, you can explore various wealth-building strategies.
