- US markets suffer worst week since 2011
- Yields, USD slip
- Oil plunge continues
Several market themes collided on Friday, weighing on equities that had already been pressured earlier in the week. The massive trading volume, greater than what had been seen in years, drove stocks to their worst week since August 2011.
The S&P 500 and Dow Jones Industrial Average both dropped significantly, down 2.06% and 1.81% respectively, while the NASDAQ, which slipped almost 3%, officially entered a bear market. Yields fell as well as investors, fleeing equities, moved into the safety of Treasurys.
Quadruple Witching, New Political Headwinds Drive Selloff
Quadruple-witching compounded volatility on Friday: futures and options expirations for indices and equities pummeled stocks which were already under pressure from rate hike jitters. This was aggravated by headlines ahead of the weekend that US President Donald Trump had discussed firing the Fed chair Jerome Powell amid an elevated risk of a coming recession.
Broader political concerns exacerbated the selloff, including the uncertainty caused by personnel turmoil in the White House and the advent of a partial government shutdown, which took effect on Saturday. Fueling concerns, the Senate adjourned on Saturday for the holiday, which means there's no hope of a deal until after the Christmas break. Trump President Trump insists on $5B to fund a border wall but doesn't have enough votes to support the funding he desires: minority leader Chuck Schumer told the president, "If you want to open the government, you must abandon the wall, plain and simple.
Still, as a rule, government shutdowns rarely impact the market in a significant way. And that’s using a 100% shutdown as an example. The current closure effects only at 25% of services; the remaining 75% continue to be funded.
Ironically, dovish comments by Federal Reserve Bank of New York President John Williams provided an early boost to stocks on Friday. He said that the central bank could reassess its interest rate policy and balance sheet reduction in the new year if the economy slows. However, escalating selling pressure later in the day overwhelmed the temporary bullish attempt.
All major US benchmarks topped out to finish the week.

S&P 500 losses were driven by its two tech sectors. Communication Services underperformed (-2.95%), followed by Technology (-2.62%). Utilities, the only sector in the green, outperformed (+0.43%).
For the week, the benchmark dropped 7.05 percent, with all sectors deep in the red. Even the two best performing sectors—Utilities and Materials (noteworthy amid tariff jitters)—each slumped 5.30 percent.
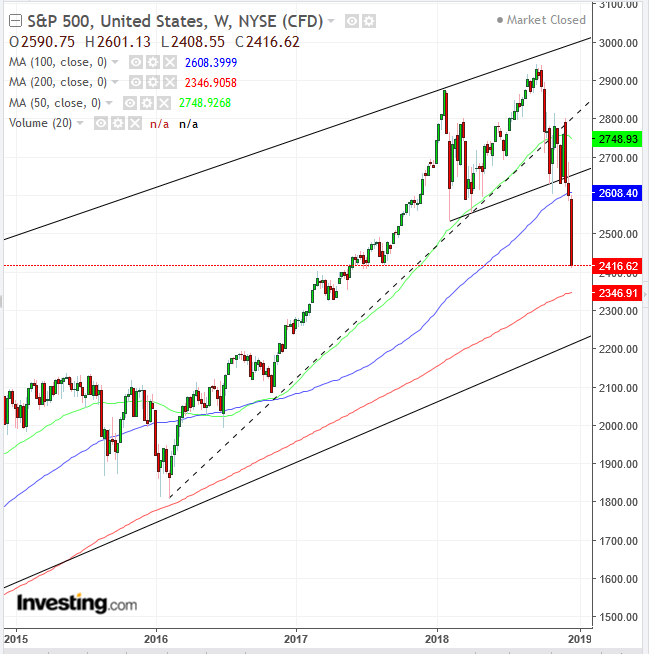
Oil's 17.5 month low enhanced the technology rout, driving an underperformance in Energy shares (-9.63%). Technically, the S&P sliced through its 100 WMA and is headed forcefully toward its 200 WMA, which is guarding the bottom of a channel in place since the mid-2009 bottom.
This is the first time this has occurred since the February 2016 bottom. The channel bottom is at 23000, another 4.5% lower, and it's the first place we'd even consider looking for a bottom.
Even though the Dow declined 414.23 points, its 1.81% loss, rendered it Friday's best performing index. On a weekly basis as well, the mega cap benchmark outperformed, shedding 6.87% of value. That would put the average in bear territory, which can snowball into an even deeper correction, as it would violate the channel bottom, for the first time since the aftermath of the 2008 crash.
We have been providing bearish signals, including the flattening of the yield curve amid a top for the 10-year yield, and a record close last week for Utilities. Markets are following through on these patterns.

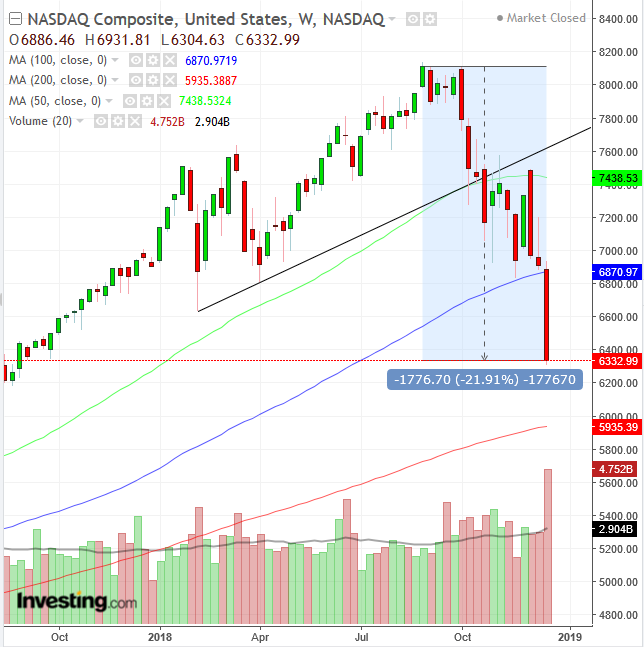
The tech-heavy NASDAQ Composite plunged on Friday, losing 2.99%. It was the laggard among the major indices. Every member of the FAANG cohort lost more than 2.5 percent, though Twitter Inc (NYSE:TWTR) plummeted even further, down more than 6 percent.
Since the summer the NASDAQ Composite has fallen over 20%, putting it in a bear market. For the week, the NASDAQ fell 7.94%.
The Russell 2000 was the second worst performer ahead of the weekend, with a 2.7 percent slump. It was also the worst performing benchmark for the week, dropping 7.94 percent, falling to its lowest level since mid-2015.
Where To From Here?
Market observers disagree as to where the market goes from here. Some consider this the bottom.
Jeffrey Saut, an analyst for Raymond James, says, on a worldwide basis, valuations are the cheapest they’ve been in a decade. The global P/E is down to 13.3 on next year’s earnings. He points out that the real yield curve yield was always the 3-month T-bill to the 30-year Treasury bond, and that is nowhere near inversion.
We could support his assertion from a technical perspective, at least in the short-term, over the next few weeks. Wednesday's 'winners'—Utilities, REITs and non-durable Consumer Staples—the areas of safety where investors may have been hiding, were sold off in forced selling, on margin calls and redemptions. This might create a short-term bottom, at least for the next couple of weeks.
Nevertheless, there's also the bearish argument.
The resignation of Defense Secretary Jim Mattis, who opted to leave the cabinet after the president announced he was pulling out US troops from Syria, added to market worries. Traders in the bearish camp expect additional bad headlines going into the holidays, with the shutdown in effect, Trump's escalating unpredictability and historically low trading volume this time of year, when markets are generally quiet.
Beginning in January, when the Democratic House majority takes over, a divided government will not make it easier for the Trump administration to get any policy decisions through, as they did with the most significant tax cut in history and regulation rollbacks, which earlier this year contributed to the so-called (positive) Trump trade.
Former presidential candidate Ron Paul believes a depression-era-sized pullback could happen within the next 12 months. The former Congressman thinks that free money—QE and near-zero interest rates—have been drugs to which investors have become addicted. The removal of accommodation, which has hidden the symptoms but worsened the condition, will cause a stock market meltdown that will be worse than what occurred in 1929.
We skew toward the bearish side of the argument, though not at the level of severity Paul is predicting. Since the selloff has been broad and deep, with topped-out benchmarks having entered at least medium-term downtrends, we believe there's now room for buyers to return.

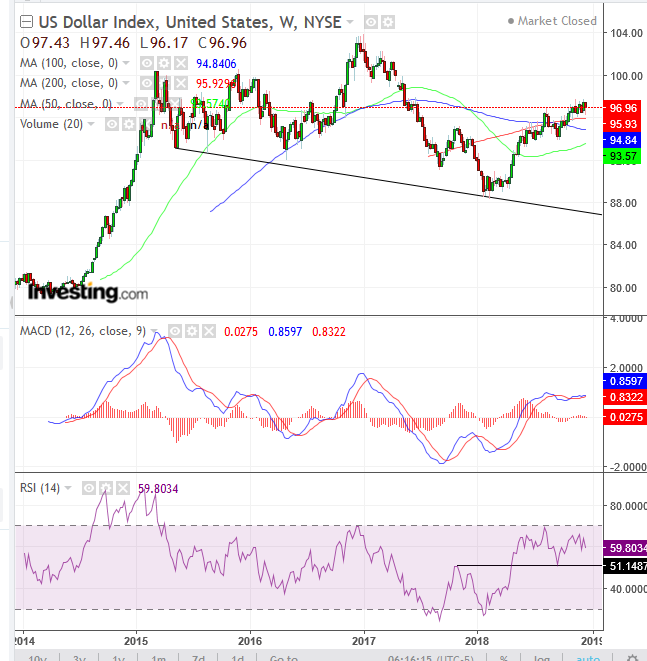
Stocks could, however, receive a surprise boost from somewhere else...the dollar. We've been noting that in the long-term, we see the dollar declining. If this turns out to be a massive top for the greenback since early 2015, as the MAs, MACD are setting up, it would give an enormous boost to multinational firms, whose less expensive exports might provide the leg up this stock market needs. This would also help the 35% of US GDP that comes from the non-US consumer side of the equation.

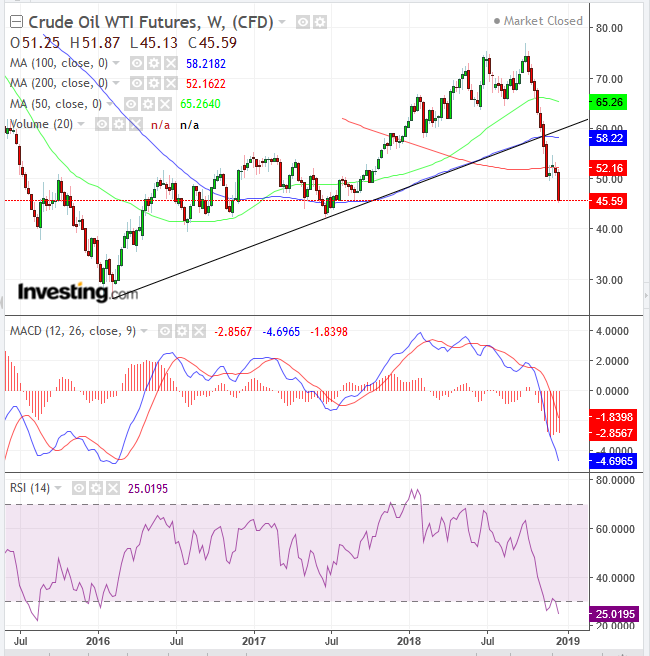
Meanwhile, oil continues to crash, reaching an almost 18-month low last week, after burning through the 200 WMA and closing near the bottom of the session on Friday.
Week Ahead
All times listed are EST
Monday
8:30: US – Chicago Fed National Activity Index (November): expected to rise to 0.9 from 0.24.
Tuesday
Christmas Day – Most Global Markets Closed
Wednesday
16:30: US – API Weekly Crude Oil Stocks: expected to be 1.3M (NYSE:MMM) from 3.45M previous
Thursday
10:00: US – Consumer Confidence (December), New Home Sales (November): confidence to fall to 133.7 from 135.7, new home sales to rise 2.5% MoM.
16:30: Japan – Unemployment Rate (November): expected to remain flat at 2.4%.
Friday
8:00: Germany – CPI (December, preliminary): prices to rise 2% YoY from 2.3%.
9:45: US – Chicago PMI (December): index to fall to 62.5 from 66.4.
10:00: US – Pending Home Sales (November): sales to rise 0.5% MoM from a –2.6%% drop last month.
11:00: US – EIA Crude Inventories (w/e 21 December): stockpiles to rise by 830,000 barrels.
