- Markets await breakthrough on US virus relief bill
- Exceptionally volatile month ahead signaled
- Equities continue to diverge from the VIX, yields and gold
While stocks ended slightly higher for the day, week and month on Friday, on strong Technology earnings and US GDP that was less negative than expected, signs the economic rebound is stalling will likely make any further equity gains an uphill battle during the coming week.
Friday's late session rally was sparked by a report the adminstration and Congressional Democrats planned to meet Saturday to strike a deal on the next coronavirus aid package. Earlier, during Wall Street trade, equities slumped, as news broke that COVID-19 deaths in Florida reached a record for the fourth day in a row, new cases in Arizona had accelerated and the rate of contagion rose in New Jersey.
Longest Period Of Gains Since 2019; Sharpest QoQ GDP Plunge In History
On a monthly basis, equities have now risen for a fourth month, the longest period of gains since December—well before the coronavirus selloff in March.
For July, the NASDAQ Composite outperformed (+1.49%). The tech-heavy index's performance was double that of runner-up the broader S&P 500 (+0.77%). Both were buoyed by strong earnings from mega cap behemoths like Apple (NASDAQ:AAPL) and Amazon (NASDAQ:AMZN).
Though shares of another tech giant, Microsoft (NASDAQ:MSFT) wavered on Friday, news that it was in negotitions to purchase TikTok's operations in the US from the video-sharing app's Chinese parent company ByteDance, helped boost the stock into the close. Ironically, later that day the US president told reporters he opposed the deal, putting a halt to negotiations till both sides could "get clarity on the White House's stance."
Good equity news notwithstanding, hopes for a solution to the July 31 expiration of $600 a week unemployment benefits remain in limbo at the time of writing, along with any additional coronavirus-related fiscal assistance, as the administration and Democrats remain at an impasse.
While GDP growth of -32.9% in the second quarter beat expectations, we would be remiss to ignore the fact it was still the sharpest quarterly downturn in history—double the 2008-2009 contraction—because of coronavirus shutdowns. As well, ratings agency Fitch posted a debt warning on the United States, downgrading the country's outlook to negative from stable because of continuous deterioration in public finances and no credible fiscal consolidation plan.
Till now, stocks have been moving higher on earnings that have beaten low expectations and economic data that's been better than anticipated. The big question is what will happen now that unemployment has run out and new jobs remain difficult to find. Will investors now rely on companies actually becoming profitable?
Will the Fed do “whatever it takes” as promised? And if so, what might that include? Will the Federal Reserve buy stocks? Will the central bank allow rates to fall below zero?
And if that doesn’t help, like it didn’t in Europe and Japan, what then? Here's the gist of our question: is there a breaking point, or will the Fed continually pump up the economy with cheap money that will succeed in pushing stocks higher and higher forever?
With the knowledge that we’ve been mostly wrong about equities since they bounced off the March lows, we continue to warn of the potential for widespread selloffs that could overtake the March bottom.
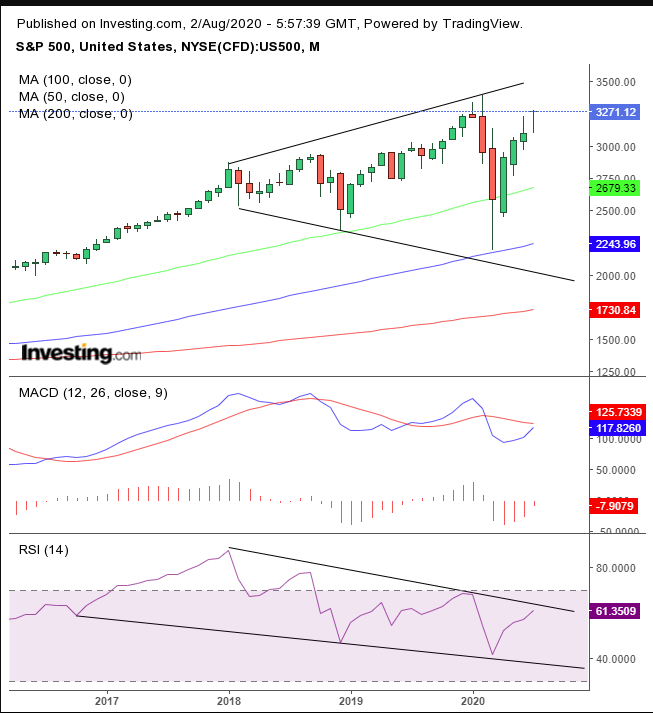
Above, a long-term view of the S&P 500. The monthly MACD is still in a sell signal, where it's been since the February selloff. The RSI has been providing a negative divergence during the same period, showing clearly how momentum has been falling, in opposition to the long-term sideways move in equities.
We say sideways because the trend has neither gone up nor down, with diverging highs and lows. This creates a broadening pattern, which is often found at market tops.
However, we’ve never seen one that's endured for 2.5 years. They tend to last a few months at most. Note too that they connote a period of great uncertainty, even fear. Will the same dynamics apply to this unusually long megaphone pattern?
Since there's nothing in the literature about it, nor have we experienced anything like this before, all we can do is speculate. Note that the 200 monthly average rushes to the pattern bottom, the 100 monthly average to the March low of the pattern and the 50 monthly moving average supports the December 2018 low as well as the March monthly closing price—seemingly assigning the pattern significance of some kind.
July’s monthly candle developed a Dragonfly Doji, similar to a hanging man but with no real body, making it potentially more dangerous. Notice that the candle developed at the resistance of a monthly shooting star produced by January’s trading, as well as the high wave candle developed in June.
Having said all that that, like a hanging man, this requires confirmation via a lower close. The extreme length of the lower shadow given that there's no real body makes us believe that August is going to be an exceptionally volatile month.
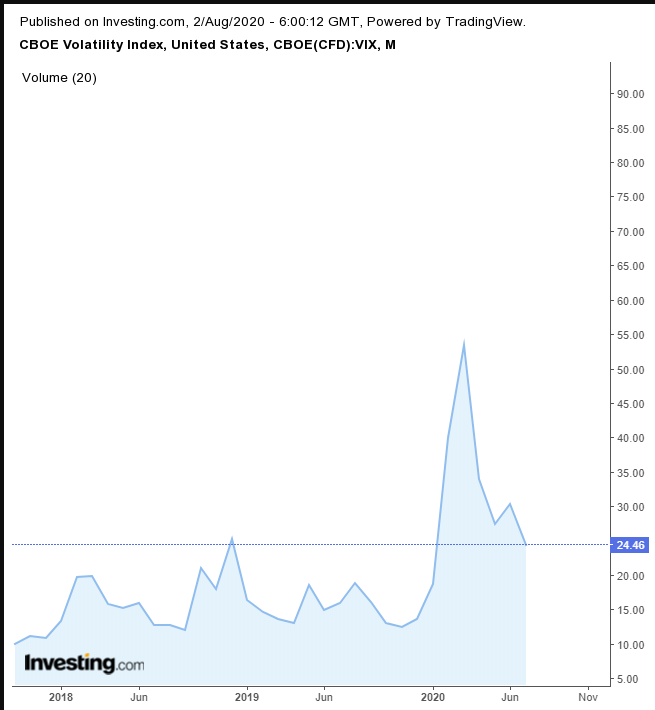
The VIX monthly chart since 2018, the same period covered in equities chart, makes it clear that even with all the exuberance following the best quarter in decades, fear remains heightened. Indeed these jitters may have found “support” above the previous highs—confirming the volatility ahead signaled by the gravestone doji on the SPX chart.
Yields, including for the 10-year Treasury, dropped on Friday for the fourth straight day.
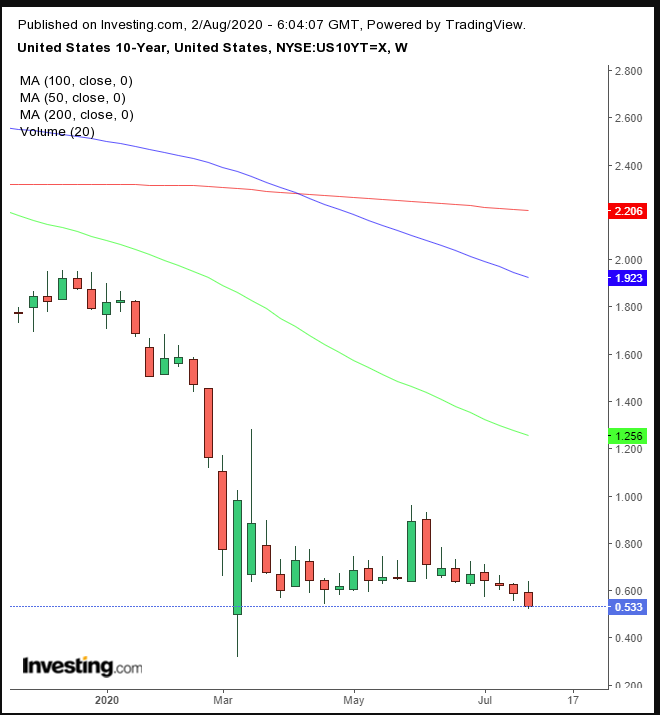
Rates fell to their second lowest level, but remained above the Mar. 8 record low—completely contradicting the pre-COVID-19 equity highs. It was also their fourth straight weekly decline. On the chart above, it's notable that last week marked a back-to-back record of weekly lows.
The dollar completed a Bullish engulfing pattern on Friday.
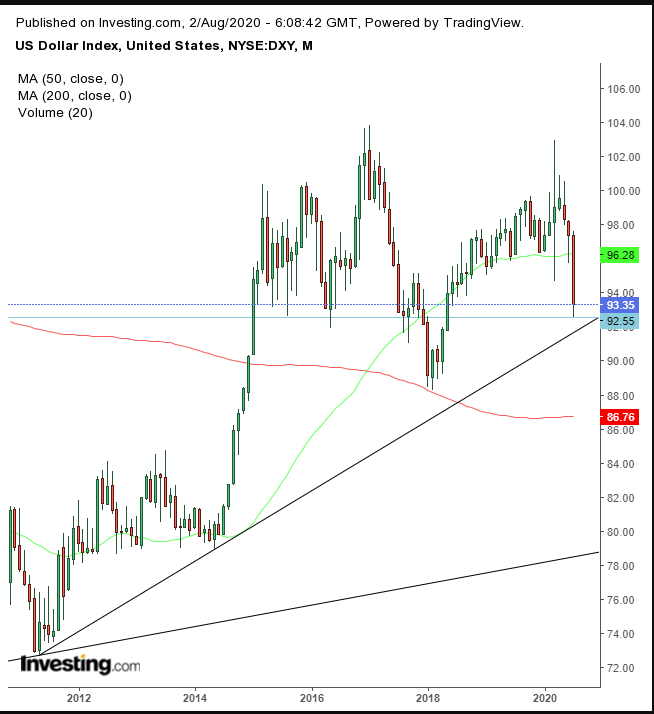
This occurs when the green candle opens lower but closes above a preceding red candle. The USD is still at its lowest point since May 15, 2018. And, while this marked the sixth consecutive week the global reserve currency is has been falling, it is nearing an uptrend line since April 2011, something worth considering.
Gold climbed for a fifth straight month and the eighth week in a row.
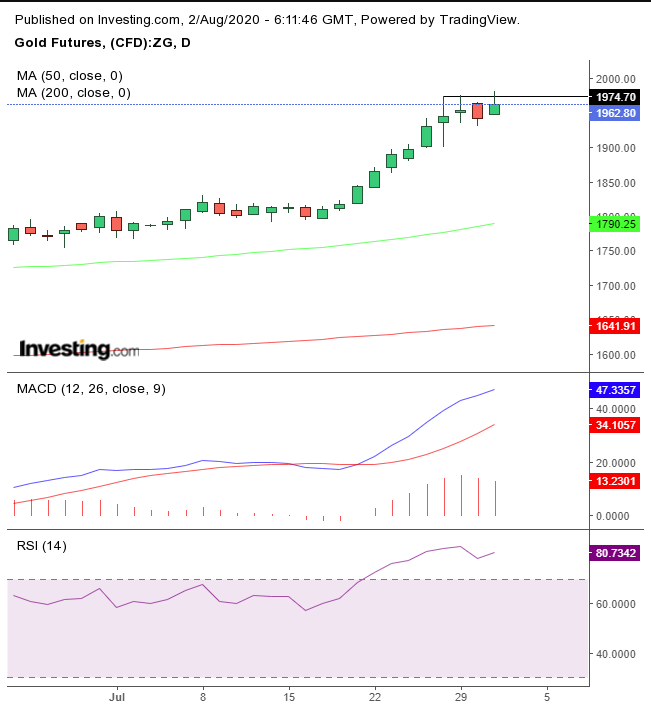
However, beware Friday’s shooting star. It confirmed the two preceding high wave candles, worth tending to in this overbought market.
While July marked the third monthly advance for oil, momentum has collapsed.
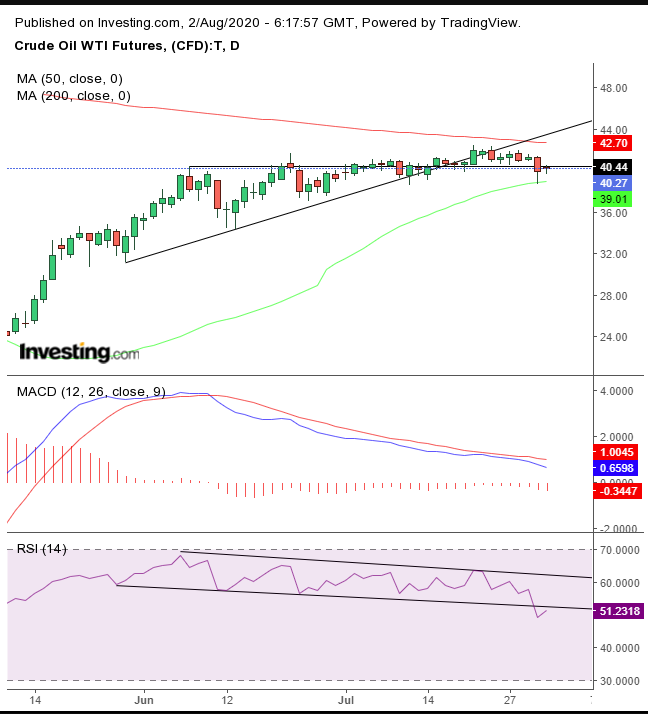
This can be seen quite clearly on the technical chart. WTI's price has been sputtering, failing to take advantage of an ascending triangle, whose rising angle makes it an innately bullish pattern. The price is being squeezed between the 50 and 200 daily moving averages, setting up the dynamics for an explosive move.
Up Ahead
All times listed are EDT
Sunday
19:50: Japan: – GDP: came in at -0.6% during the previous quarter.
21:45: China – Caixin Manufacturing PMI: expected to edge up to 51.3 from 51.2.
Monday
3:55: Germany – Manufacturing PMI: seen to climb to 50.0, minimum expansion territory, from the contractionary 45.2 level.
4:30: UK – Manufacturing PMI: probably advanced to 53.6, extending expansion from the from 50.1 level.
10:00: US – ISM Manufacturing PMI: likely rose to 53.6 from 52.6.
21:30: Australia – Retail Sales: anticipated to have plunged to 2.4% from 16.9%.
Tuesday
00:30: Australia – RBA Interest Rate Decision: predicted to remain at 0.25%.
18:45: New Zealand – Employment Change: expected to have dropped to -1.9% in Q2, from 0.7%.
Wednesday
4:30: UK – Services PMI: seen to have jumped to 56.6 from 47.1.
8:15: US – ADP Nonfarm Employment Change: forecast to drop to 1,500K from 2,369K.
10:00: US – ISM Non-Manufacturing PMI: anticipated to have edged down to 55.0 from 57.1.
10:30: US – Crude Oil Inventories: likely to have jumped to 0.375M from -10.612M.
Thursday
2:00: UK – BoE Inflation Report, MPC Meeting Minutes, Interest Rate Decision: predicted to stay at 0.10%.
4:30: UK – Construction PMI: seen to climb to 57.0 from 55.3.
8:30: US – Initial Jobless Claims: printed last week at 1,434K.
Friday
8:30: US – Nonfarm Payrolls: expected to plummet to 1,518K from 4,767K.
8:30: Canada – Employment Change: anticipated to more than halve to 415.0K from 952.9K
10:00: Canada – Ivey PMI: last month's reading was 58.2.
