The S&P 500, which is up 13% in 2021, is hovering near an all-time high. Similarly, a number of sectors have also seen above-average increases this year. Amid such juicy gains, many investors wonder whether they should take profits in winning names in their portfolios.
Therefore, today we introduce two exchange-traded funds (ETFs) that have had sizeable returns year-to-date and could see some profit-taking soon.
Each portfolio is unique, and investors could have different reasons to get out of stocks or funds. For instance, valuation levels might have become frothy from a historical perspective.
Investors who also follow technical indicators, might also feel the momentum in a given stock is starting to fade. The charts might be signaling caution ahead. Or, they might simply want to use their profits to buy other high-quality stocks or funds that have been under pressure to add to their portfolios.
With that as background, here are two funds that we feel could come under short-term pressure in the coming weeks.
1. iShares U.S. Financials ETF
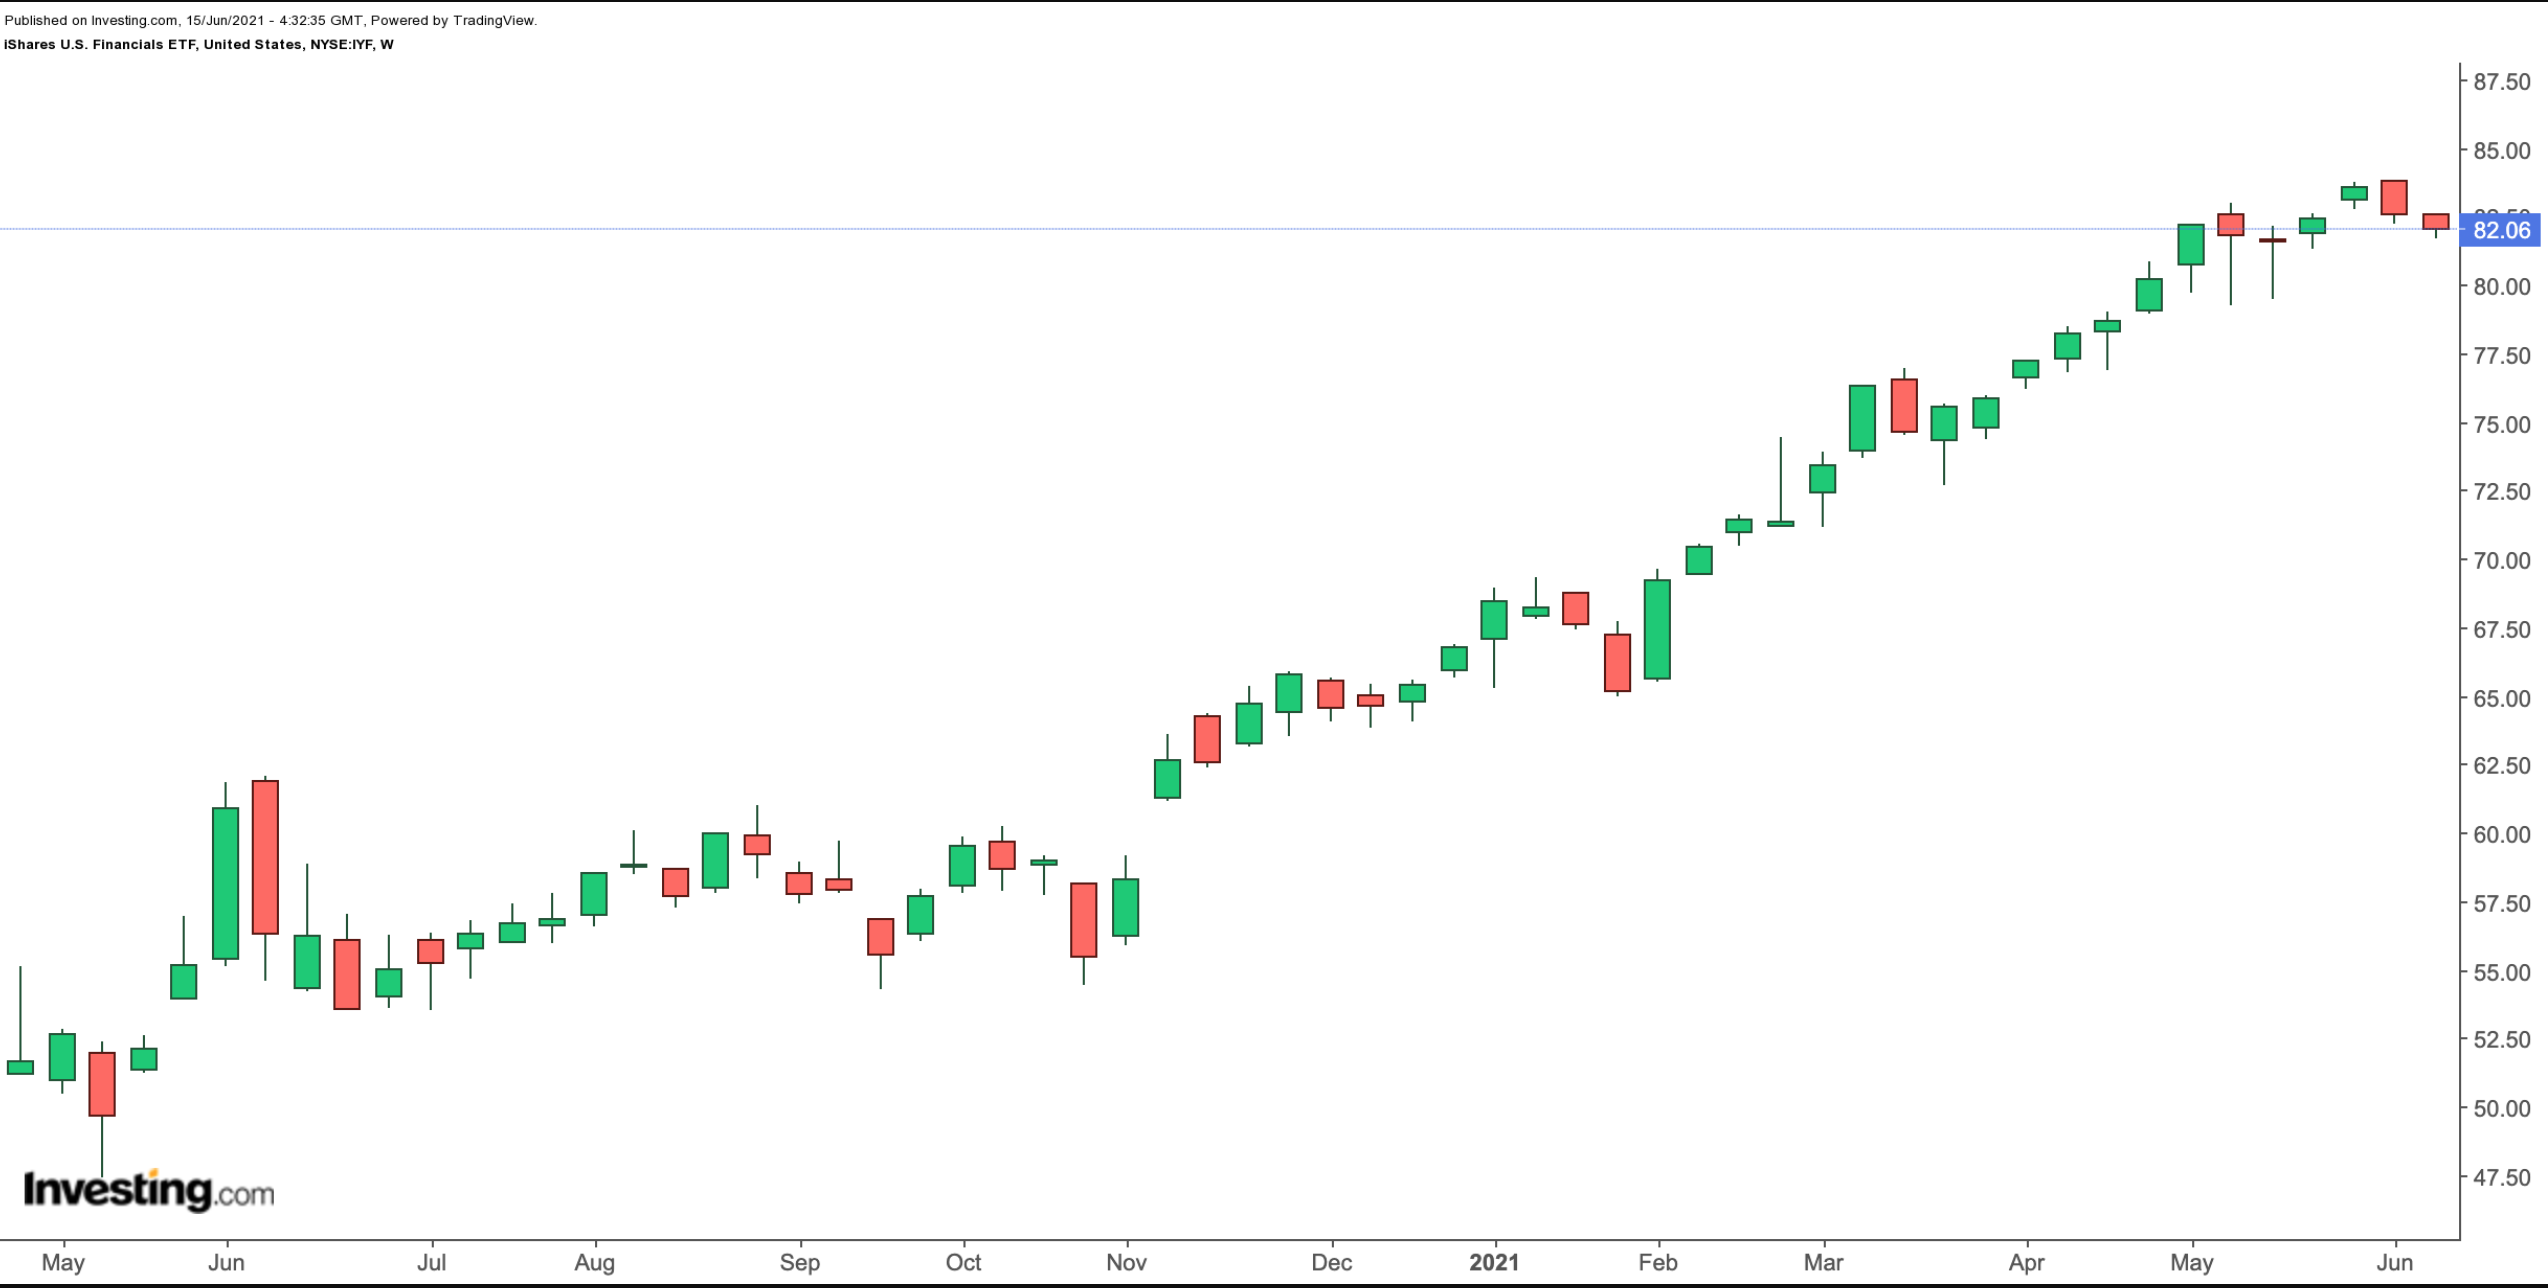
Current Price: $82.06
52-Week Range: $53.51 - $83.82
Dividend Yield: 1.53%
Expense Ratio: 0.42% per year
Analysts have been debating whether rapid interest rate rises may lie ahead in the US (covered here). Such an increase would mean improved profit margins for financials, especially banks. In anticipation of a move by the Fed, many investors have been betting on the sector.
Furthermore, financial institutions typically benefit as the economy and consumer spending rev up. Therefore, as the U.S. economy opens up further, expectations for the sector have been high. As cyclical stocks, financials typically do well when the economy is strong. For instance, the Dow Jones Financials is up almost 40% year-to-date (YTD). Many sectors pale in comparison to the profits showering down on financials.
The iShares US Financials ETF (NYSE:IYF) returned about 46% in the past 12 months and 23% YTD. The fund, which hit an all-time high (ATH) in June, provides exposure to the U.S. financial industry, including insurance, credit card companies, and banks.

IYF, which started trading on May 22, 2000, tracks the Dow Jones U.S. Financials Capped Index. The top 10 holdings comprise nearly 40% of the net assets, which is close to $2.45 billion.
In other words, although the ETF has 231 holdings, it is top-heavy. As a result, the performance of the leading names could easily affect how the fund moves. The top five names are Berkshire Hathaway (NYSE:BRKb), JPMorgan Chase (NYSE:JPM), Visa (NYSE:V), Bank of America (NYSE:BAC) and Mastercard (NYSE:MA).
As far as sector allocations are concerned, diversified financials lead with 31.77%, followed by banks (25.93%), real estate (19.40%), insurance (12.50%) and software and services (9.63%).
July will mean a slew of earnings updates, and financials are among the first companies to get the earnings ball rolling. Until then, some investors could decide to take money off the table. Such a decline in IYF, especially toward $78, would offer a better entry point for long-term investors.
We should note that despite the potential for short-term profit-taking, we’re bullish on many of the names in the fund for the long run. Later in the summer, better-than-expected earnings reports could easily see the fund’s fortunes boosted further.
2. Invesco S&P MidCap 400 Revenue ETF
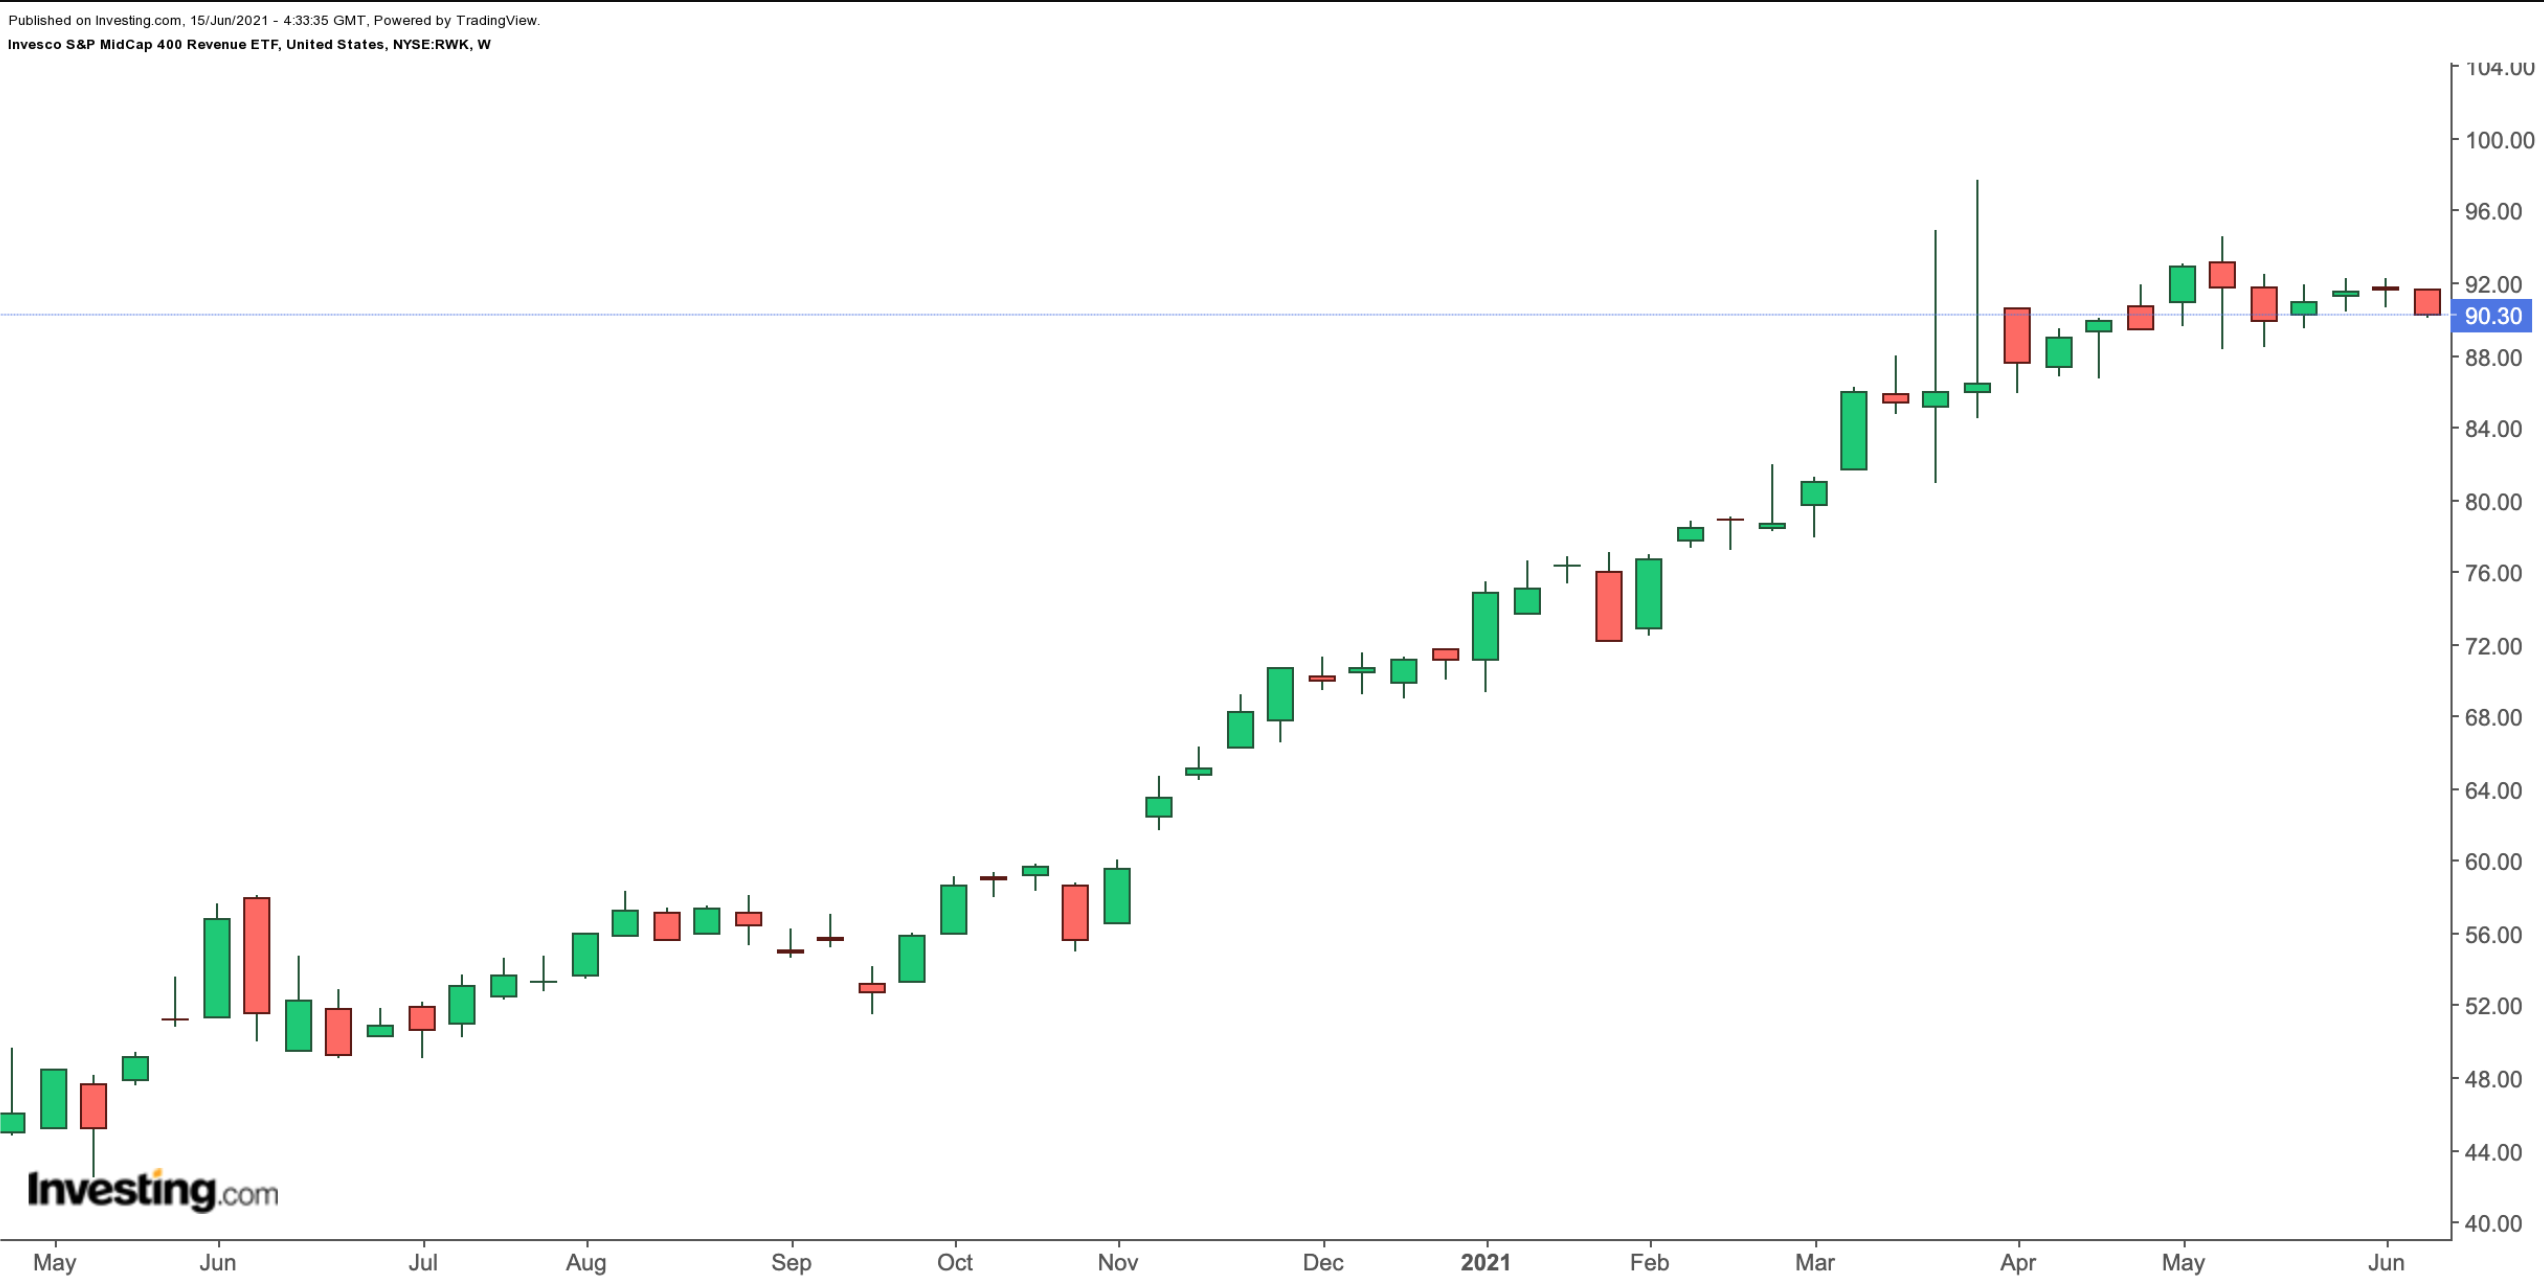
Current Price: $90.30
52-Week Range: $49.05 - $97.65
Dividend Yield: 0.69%
Expense Ratio: 0.39% per year
The Invesco S&P MidCap 400 Revenue ETF (NYSE:RWK) provides exposure to securities of mid-capitalization U.S. companies. The definition of mid-caps might differ among U.S. brokerages and fund sponsors, but they typically have market caps of between $2 billion and $10 billion. However, many funds will include companies with higher valuations, too.
In 2020, a large number of tech titans became the darlings of the stay-at-home era. As the vaccination roll-out increased in early 2021, investors realized that mid-caps should potentially benefit from better earnings as the economy recovers. As a result, the S&P Midcap 400 is up almost 20% YTD.
Similarly, RWK has had a great year and returned more than 28%. It is hovering around the record-high seen earlier in late March. The ETF, which tracks the S&P MidCap 400® Revenue-Weighted Index, has 389 holdings and is rebalanced quarterly.

The fund began trading in February 2008. The top sector allocation is industrials (21.40%), followed by consumer discretionaries (20.28%), information technology (14.47%), financials (12.37%) and materials (8.40%).
The largest 10 holdings constitute around 17% of net assets, which total $424 million. The top companies in the fund include the electronic manufacturing solutions provider, Jabil Circuit (NYSE:JBL), electronic components distributor, Arrow Electronics (NYSE:ARW), IT integration and distribution provider, Synnex (NYSE:SNX), automotive retailer, AutoNation (NYSE:AN) and health-care group, Tenet Healthcare (NYSE:THC).
We believe most retail portfolios should have some exposure to mid-caps. Therefore, a potential short-term decline toward $85 would provide a better opportunity to buy into RWK.
