While yesterday we addressed socially responsible ETFs, today we'll look at the opposite end of the spectrum: "sin" or "vice" stocks.
These stocks include those in alcohol, cannabis, gambling, adult entertainment and defense industries. Market participants whose personal convictions permit them to invest in "sin stocks" can benefit as they offer added diversification.
Not only does the use of tobacco and alcohol tend remain stable even in recessionary times, but many of these companies also deliver robust dividend payouts. Similarly, defense shares usually outpace the growth of broader markets—such as the S&P 500 index—during economically challenging times.
With all that in mind, here are two vice ETFs to consider:
1. Advisor Shares Vice ETF (ACT)
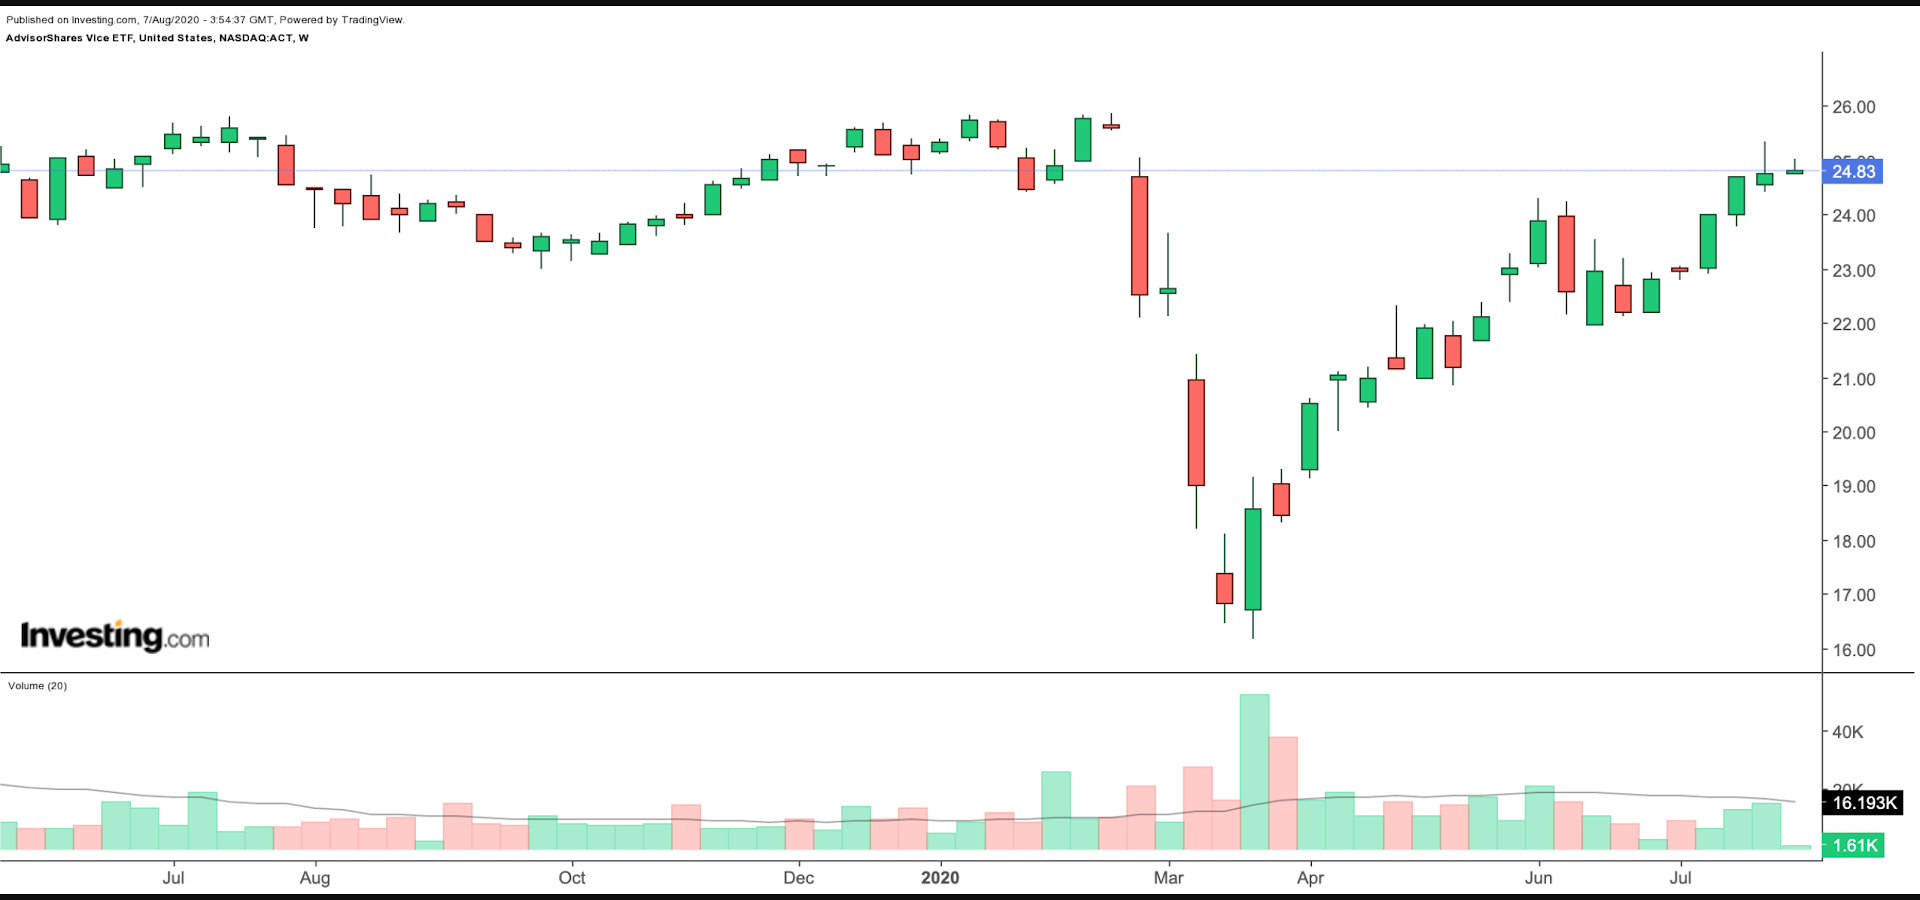
- Current Price: $24.83
- 52-Week Range: $16.16 - 25.85
- Dividend Yield (TTM-Trailing Twelve Month): 2.52%
- Dividend Distribution Frequency: Annually
- Net Expense Ratio: 0.99 % per year, or $99 on a $10,000 investment
The AdvisorShares Vice ETF (NASDAQ:ACT), which has 32 holdings, seeks concentrated exposure to mainly US-listed equity securities of alcohol and tobacco companies. ACT states that it only invests in cannabis-related companies conducting federally legal business per the US government.
It is essential to highlight that in 2018, Canada became the first G7 nation to legalize cannabis federally, i.e., nationwide.
However, at the federal level, marijuana is illegal in the US and remains a Schedule I drug. On the other hand, at the state level, the legal status of marijuana depends on the laws of the individual state.
In other words, the legalized marijuana industry is still in its infancy, even in Canada, and it is almost non-existent globally. Yet, the legal cannabis market is expected to be worth over $70 billion by 2027. The medical segment will likely hold the leading revenue share of about 70%. And the rest will be recreational adult-use.
The listing requirements at the NYSE or NASDAQ as well as at the Toronto Stock Exchange (TSE) bar companies from engaging in commercial activities in countries where they would be breaking the law.
Sector allocation of the exchange-traded fund (by weighting) is as follows: Cannabis-related (40.9%), Alcohol (27.1%), Alcohol with Cannabis Exposure (8.6%), Tobacco with Cannabis Exposure (8.6%), Tobacco (5.80%) and Restaurant & Entertainment (9.0%).
The top ten holdings comprise around 60% of total net assets, which stand at almost $10 million. ACT's top three companies are Boston Beer Company (NYSE:SAM), Thermo Fisher Scientific (NYSE:TMO) and Abbott Laboratories (NYSE:ABT).

Year-to-date, the fund is down 0.96%, i.e., practically flat. However, earlier in March, ACT hit an all-time low of $16.16 and since then it is up over 50%, so $1,000 invested in ACT in early spring would now be worth over $1,500.
2. ETFMG Alternative Harvest ETF
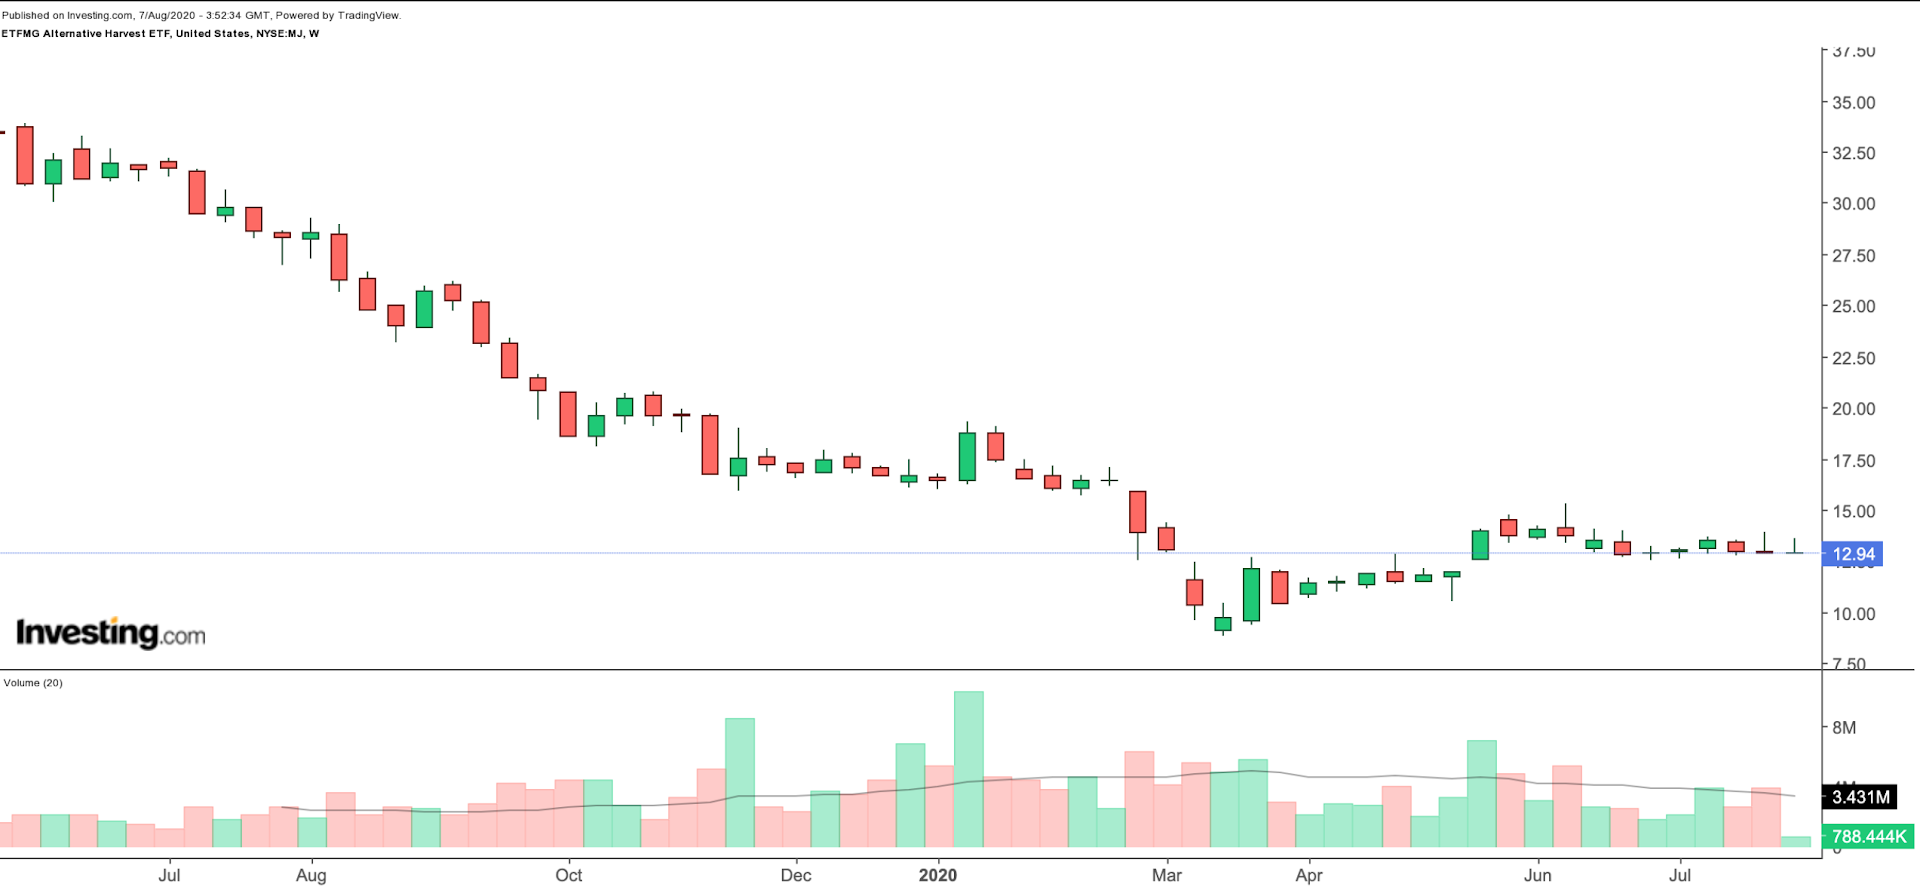
- Current Price: $12.94
- 52-Week Range: $8.81 - 29.25
- Dividend Yield (TTM-Trailing Twelve Month): 7.57%
- Dividend Distribution Frequency: Quarterly
- Expense Ratio: 0.75 % per year, or $75 on a $10,000 investment
ETFMG Alternative Harvest ETF (NYSE:MJ), which has 36 stocks, tracks the Prime Alternative Harvest index.
This benchmark index measures the performance of companies benefitting from global medicinal and recreational cannabis legalization initiatives. Like ACT, MJ does not invest in any US or foreign companies whose business activities would be illegal under any applicable federal or state law.
Sector allocation of the fund (by weighting) is as follows: Pharmaceuticals (56.4%), Tobacco (24.7%), Biotechnology (9.1%), Fertilizers & Agricultural Chemicals (3.1%), Paper Products (2.6%), Agricultural Products (2.4%) and Asset Management & Custody Banks (0.6%).
The top ten holdings make up close to 60% of total net assets, which are around $555 million. MJ's top three companies are GW Pharmaceuticals (NASDAQ:GWPH), Cronos Group (NASDAQ:CRON), and Canopy Growth (NYSE:CGC).
UK-based GW Pharmaceuticals, a leading cannabinoid-focused biotech company, is MJ's largest holding, accounting for 11.1% of its assets.
A 2018 report by the United Nations revealed that Britain is the biggest producer and exporter of legal cannabis in the world. Virtually all of the UK's cannabis exports are contained in one drug, Sativex, which is produced by UK-based GW Pharmaceuticals. It is used to treat spasms in multiple sclerosis patients.
Currently, it is hovering at around $132.10, GWPH stock soared from about $10 in 2013 to an all-time high of $196 in May 2019.
MJ also owns shares of the companies that provide ancillary products and services to the cannabis companies, including Scotts Miracle-Gro (NYSE:SMG), which is known for its fertilizer products.
So far in the year, MJ is down about 24%. However, since late March, the fund is up over 50%.
Bottom Line
Market participants may be able to decrease the volatility of investing in individual stocks by holding more of them or by investing in an ETF. And thematic funds such as ACT or MJ can help investors construct a diversified portfolio. As always, before investing in any ETF, it is essential to do further due diligence.
