- The V-shaped recovery narrative persists despite an ongoing pandemic, grim economic data and protests in the US
- Despite risk-on, yields remian depressed, showing investor concerns linger
- Gold falls because of its safe haven status
Key Events
US futures for the Dow Jones, S&P 500, NASDAQ and Russell 2000, and global stocks all extended an advance on Wednesday, fueled by increasing chatter of an immediate economic recovery and Tuesday's strong Wall Street performance. As well, Asian indices were all boosted by positive Chinese economic data as markets continue to disregarding a pandemic that keeps spreading as well as dire economic data and social unrest in the US.
Gold is trading lower and the dollar continues to slip. Oil is holding above $36.
Global Financial Affairs
Contracts on the major US indices opened higher this morning, on expectations of a V-shaped recovery despite a lack of progress on a medical solution for COVID-19 and the strong possibility of a second wave in countries that have ended lockdowns,such as Israel and Japan where new cases have spiked.
After S&P 500 futures yesterday broke to the topside of a symmetrical triangle on the four-hour chart, they just kept going.
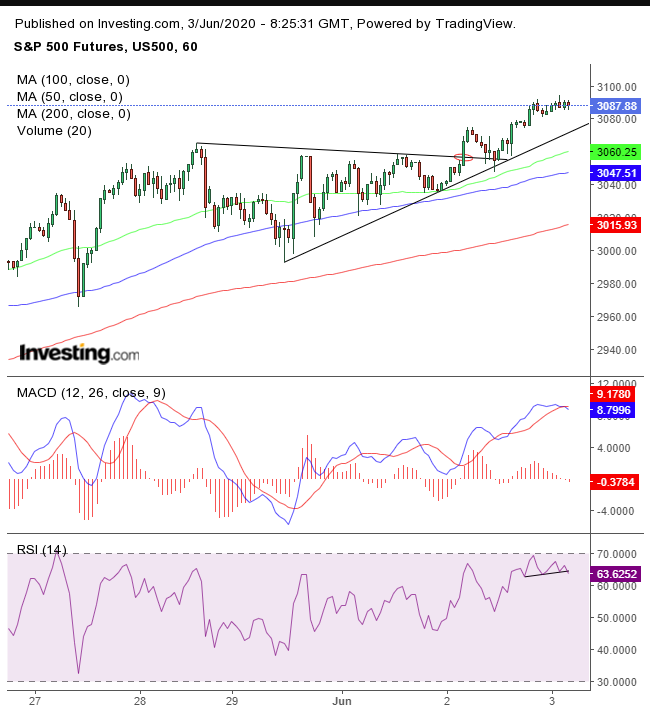
This morning, however, after churning for the last four hours, and with indications from both the MACD and the RSI turning lower, it looks like the index is due for at least a pullback.
The pan-European STOXX 600 Index climbed, buoyed by automobile makers and insurance firms, reaching its highest level since March 6.
In Asia today, South Korea’s KOSPI outperformed, (+2.9%), reaching the highest since Feb. 21, lifted by a third round of fiscal stimulus from Seoul. China’s Shanghai Composite lagged, trading less than 0.1% in the green. After outperforming much of the time despite the brewing trade war with the US, the SSEC ironically underperformed when good economic data was released. Caixin Services PMI jumped to 55.0, into positive growth territory, buttressing the narrative that the worst is behind China, pushing global stocks higher.
Yesterday, during the New York session, US equities advanced for the third day, with wide participation. For every decliner, two stocks advanced, pushing Wall Street benchmarks to their highest since March 4.
Despite the rally, yields, including for the 10-year benchmark Treasury note, remain trapped within a presumably bearish pattern.
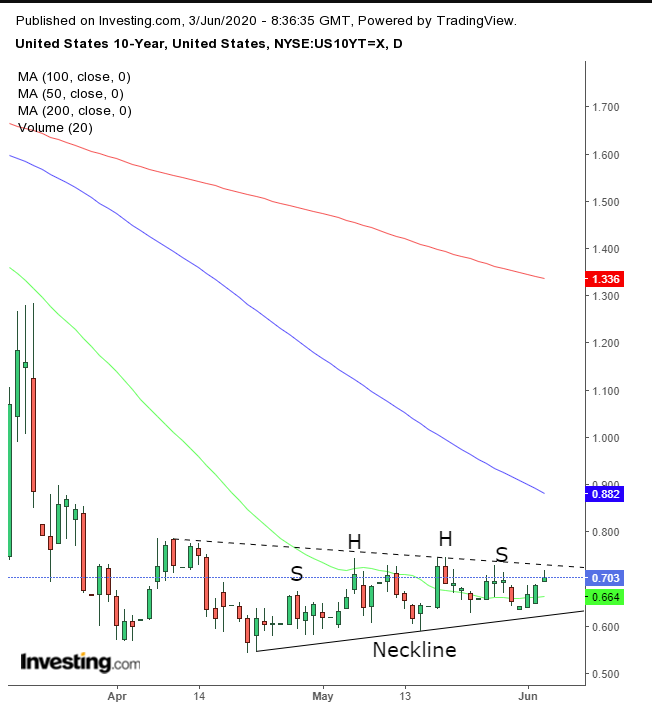
We use the term presumably because the formation isn't fully defined: it could be a symmetrical triangle after a decline or a H&S continuation pattern, after a decline. If investor sentiment were truly risk-on yields would have been sent much higher. The fact that 10-year yields are forming a shooting star at the top of the pattern demonstrates there's still continuous demand for the ultimate safe haven asset.
The dollar selloff extended for a sixth straight day.
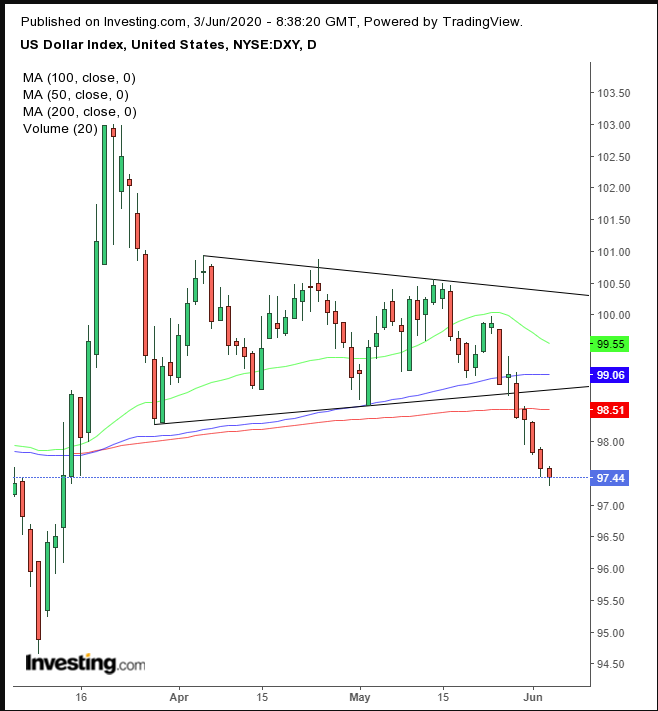
This after completing a bearish triangle and falling below the 200 DMA, while obliterating an attempt for a rebound following a bullish hammer.
Gold is falling for the second day, despite the USD selloff. It's being pressured by its safe haven status, unlike yields.
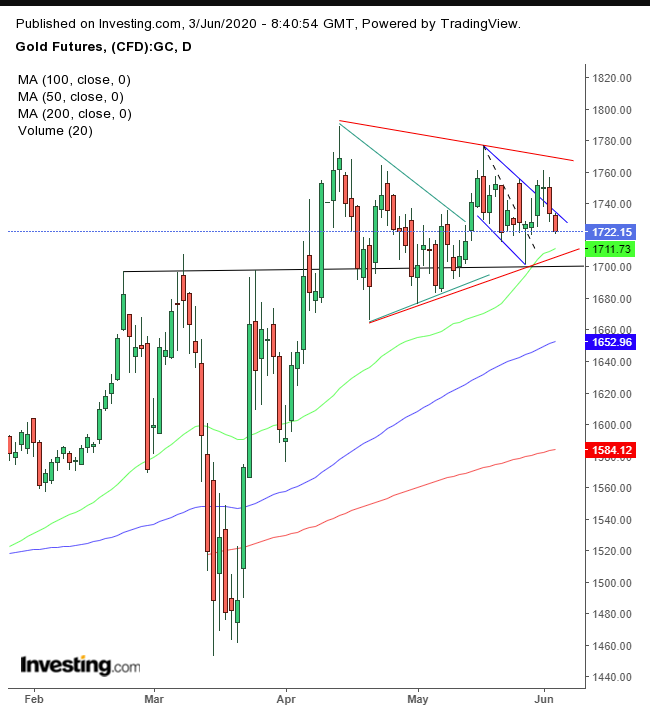
It’s difficult to say whether the price of the yellow metal has already completed a falling flag (dotted line) or is continuing to develope a larger one. What's certain: trading is developing a symmetrical triangle (red lines), after completing a smaller one (green lines) and a H&S continuation pattern.
Oil is off the session’s high, above $37, at time of writing, but remains above $36 for a second day.
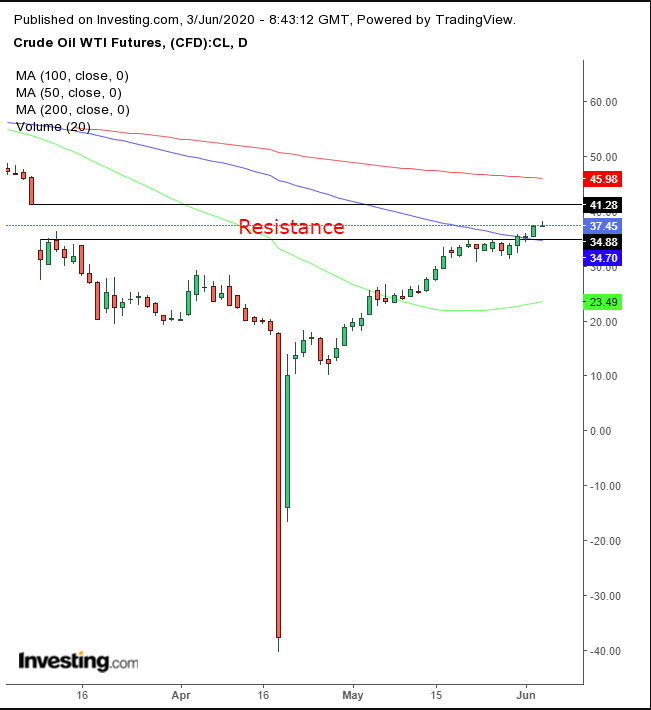
Technically, the top of the March 29 falling gap, at $41.28, is a presumed resistance.
Up Ahead
- In Europe, on Thursday, the ECB is expected to top up its rescue program with an additional 500 billion euros of asset purchases. Anything less than an expansion would be a big shock, Bloomberg Economics said.
- The much anticipated, monthly U.S. labor market report on Friday will probably show American unemployment soared to 19.5% in May, the highest since the 1930s.
Market Moves
Stocks
- The Stoxx Europe 600 Index climbed 0.9%.
- Futures on the S&P 500 Index rose 0.3%.
- Italy’s FTSE MIB Index gained 1.4%.
- The MSCI Asia Pacific Index increased 1.4%.
Currencies
- The Dollar Index declined 0.2% or 1.7 for the past five days.
- The euro gained 0.4% to $1.1215.
- The British pound jumped 0.4% to $1.2603.
- The Japanese yen was little changed at 108.66 per dollar.
- The Indian rupee was little changed at 75.371 per dollar.
Bonds
- The yield on 10-year Treasuries climbed two basis points to 0.70%.
- Germany’s 10-year yield increased three basis points to -0.38%.
- Britain’s 10-year yield climbed two basis points to 0.243%.
Commodities
- Brent crude gained 1.8% to $40.27 a barrel.
- Gold weakened 0.3% to $1,722.45 an ounce.
- LME copper dipped 0.3% to $5,510 per metric ton.
- Iron ore was little changed at $98.15 per metric ton.
