- US futures buck the global bullish trend
- Yields reach highest level since January 2020
Key Events
NASDAQ futures led in a selloff in trading on Thursday with futures for both the S&P and Russell 2000 also lower as a resumption of the Treasury selloff suggests the markets' faith in the Federal Reserve might be eroding. Futures on the Dow were only marginally in the green.
The dollar and gold were higher.
Global Financial Affairs
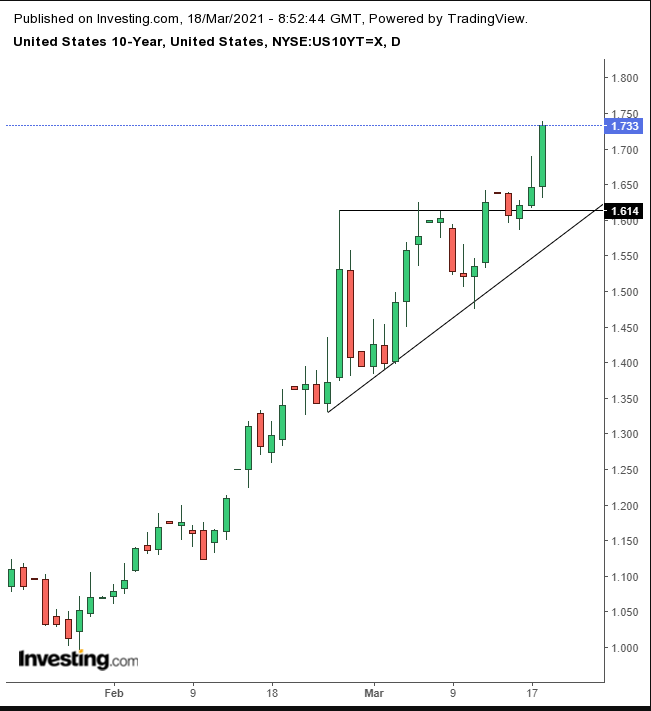
Yields on the 10-year Treasury note shot past 1.7%, and were a hair away from the 1.75% level last seen on Jan. 22, 2020, as the ascending triangle pattern predicted.

Contracts on the tech-heavy NASDAQ 100—which benefited the most from lockdowns, pushing their valuations to dotcom proportions—were 1.3% lower at the time of writing, almost double that of small caps listed on the Russell 2000.
Sure, the current selloff may be temporary profit-taking after the Federal Reserve expressed its willingness to continue supporting the economy, as well as prop up equities at all-time highs against the growing angst of rising inflation and the higher rates expected to follow.
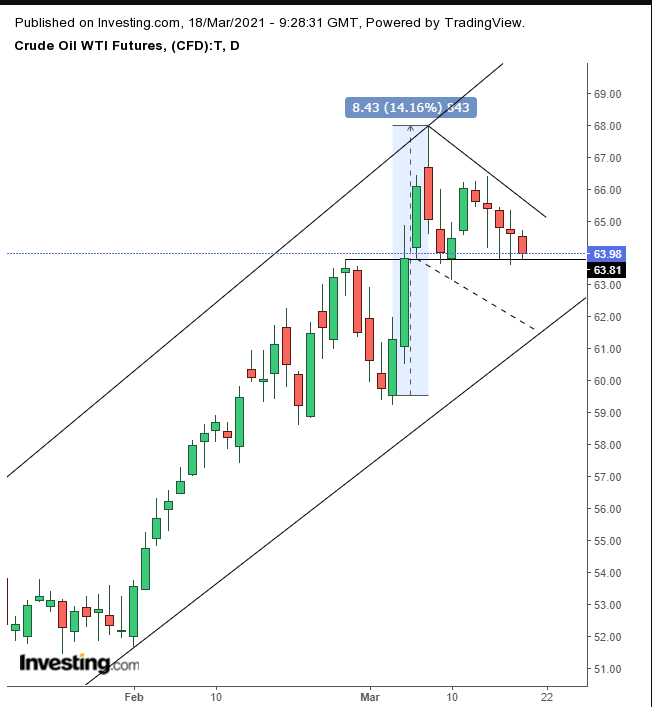
However, we do not think so. When such meaningful policies have been announced before, stocks climbed for more than one day. When OPEC announced it was keeping production cuts in place, oil surged 8.4% over three straight days, before profit-taking. To clarify, the trading of one morning does not establish a trend, and this could just be noise. It is telling however, that it is taking place just one day after the Fed gave the store away.
The Fed said it would maintain its ultra-accommodative policy—it plans to keep rates near-zero until 2023, continue buying assets with no plans to taper QE and provide incredibly loose forward guidance. It is also not concerned about inflation, saying it is transitory. But at the same time it increased its core PCE forecast from 1.8% to 2.2%. Is that short-lived?
The Fed said it does not want to act pre-emptively, just based on forecasts. So the same Fed that published its dot-plot—its forecast on interest rates—is telling the market that it does not want to act based on forecasts. Oh, and while the Fed is claiming that the PCE forecast is temporary, it forecast that GDP will surge to 6.5% from 4.2%.
Perhaps the reason for today's sell-off is that traders who were betting that the Fed's continuous, unflinching support would stimulate the economy to grow faster were starting to acknowledge some of the multiple inconsistencies in the messaging.
Because, as we see it, we could expect one of the following two developments:
- the Fed breaks an oft-repeated promise of not raising rates and tapering bond purchases, or
- keeps its promise but lets the economy run off a cliff.
Unless inflation fails to increase, it’s one or the other. As of now, the continued Treasury selloff demonstrates that investors are readjusting positions to adapt to one or the other, if not both.
In Europe, the STOXX 600 Index rose with carmakers and banks, which are expected to rise amid the shift from growth to value.
Japan’s Topix closed at over 2000 for the first time since 1991.
In yesterday’s trading, US stocks climbed to record highs as long-maturity yields fell back from highs of over a year, after the Fed reiterated its same message.
The dollar rebounded.

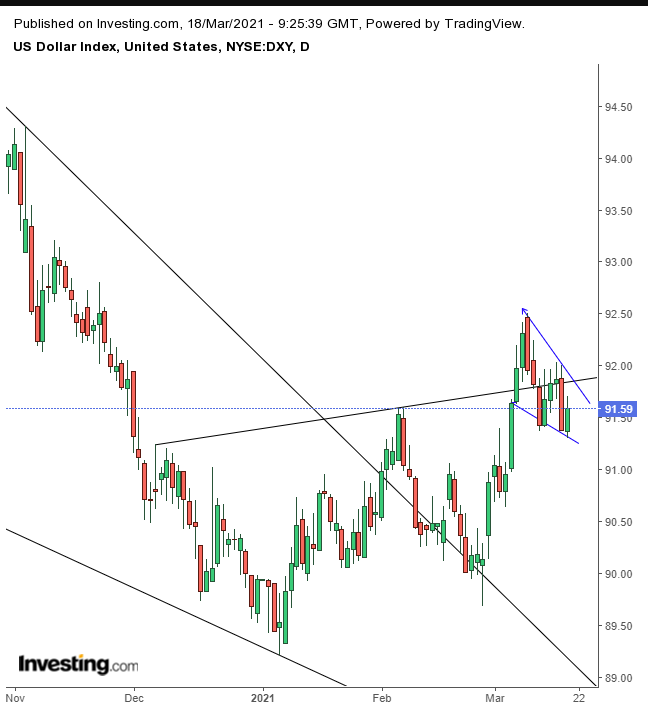
The greenback's recovery was from what may be the bottom of a falling flag, whose position makes sense, as the price struggles to complete a double bottom born from a falling wedge since the March peak.
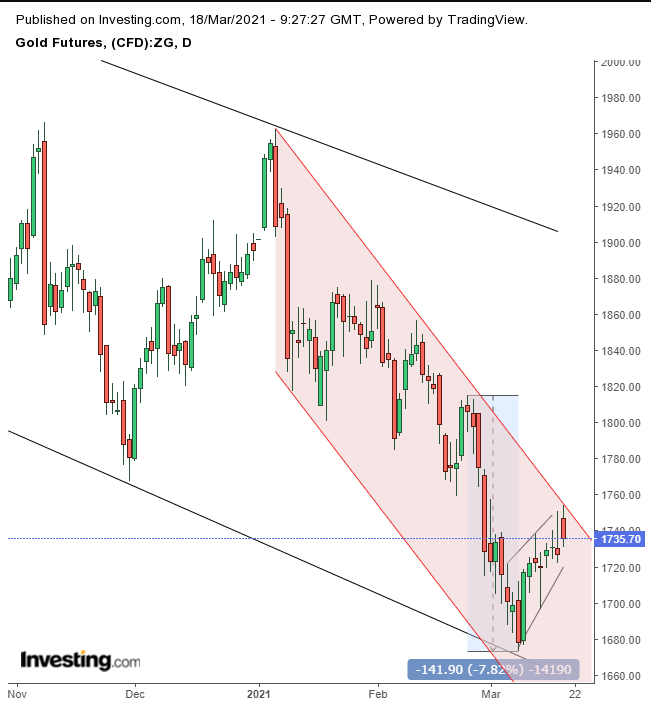
Gold jumped but found resistance by the top of a rising flag—bearish after the preceding 7.8% plunge.

If the flag completes, with a downside breakout, it could indicate that the yellow metal will begin a steeper decline, along the red channel.
Bitcoin edged lower after a two-day advance.
Oil, which has an inverse relationship with the dollar, also slid.

The liquid gold may be trading within a falling flag, as the price corrects within a rising channel.
Up Ahead
- On Friday, Canada releases its retail sales figures.
- The Bank of Japan announces its monetary policy decision and Governor Haruhiko Kuroda holds a briefing on Friday.
Market Moves
Stocks
- Futures on the S&P 500 Index declined 0.3%.
- The STOXX 600 Index climbed 0.2%.
- The MSCI Asia Pacific Index rose 0.8%.
- The MSCI Emerging Markets Index gained 0.6%.
Currencies
- The Dollar Index rose 0.25%.
- The euro fell 0.2% to $1.1953.
- The British pound was little changed at $1.3963.
- The onshore yuan was little changed at 6.503 per dollar.
- The Japanese yen weakened 0.3% to 109.14 per dollar.
Bonds
- The yield on 10-year Treasuries climbed 15 basis points to 1.72%.
- The yield on two-year Treasuries climbed one basis point to 0.14%.
- Germany’s 10-year yield gained two basis points to -0.27%.
- Japan’s 10-year yield increased one basis point to 0.114%.
- Britain’s 10-year yield rose four basis points to 0.869%.
Commodities
- West Texas Intermediate crude dipped 1.1% to $63.89 a barrel.
- Brent crude declined 1.2% to $67.20 a barrel.
- Gold weakened 0.4% to $1,737.78 an ounce.
