Breaking News
Investing Pro 0
🚨 NDVA surged 43%. This AI Chipmaker Could Be Next See Analysis

Opening Bell: Stocks, Futures Rise On Lingering Stimulus Hopes; Gold Drops

By Investing.com (Pinchas Cohen/Investing.com)Market OverviewAug 11, 2020 06:49
ca.investing.com/analysis/opening-bell-stocks-futures-rise-on-lingering-stimulus-hopes-gold-drops-200439220
Opening Bell: Stocks, Futures Rise On Lingering Stimulus Hopes; Gold Drops
By Investing.com (Pinchas Cohen/Investing.com)   |  Aug 11, 2020 06:49
Saved. See Saved Items.
This article has already been saved in your Saved Items
 
 
CL
-1.32%
Add to/Remove from a Portfolio
Add to Watchlist
Add Position

Position added successfully to:

Please name your holdings portfolio
 
LYFT
-1.42%
Add to/Remove from a Portfolio
Add to Watchlist
Add Position

Position added successfully to:

Please name your holdings portfolio
 
MIAP0...
-0.05%
Add to/Remove from a Portfolio
Add to Watchlist
Add Position

Position added successfully to:

Please name your holdings portfolio
 
TCEHY
-0.40%
Add to/Remove from a Portfolio
Add to Watchlist
Add Position

Position added successfully to:

Please name your holdings portfolio
 
Zinc
-0.65%
Add to/Remove from a Portfolio
Add to Watchlist
Add Position

Position added successfully to:

Please name your holdings portfolio
 
STOXX
-0.15%
Add to/Remove from a Portfolio
Add to Watchlist
Add Position

Position added successfully to:

Please name your holdings portfolio
 
  • S&P 500 just 0.75% from record
  • Nasdaq’s first back-to-back selloff in 3 months
  • Gold falls the most since March bottom

Key Events

US futures for the Dow Jones, S&P 500, NASDAQ and Russell 2000 all jumped on Tuesday, along with European and Asian shares.  The optimism was spurred by lingering hopes of a resolution to the Congressional stalemate regarding additional US fiscal stimulus and by what appear to be easing tensions on the Sino-US diplomatic front.  

Yields reached their highest level since late July, the dollar's rally fizzled and gold was sold off.

Global Financial Affairs

Contracts on the four main US benchmarks were at least 0.5% higher this morning, with small caps and the mega cap YM outperforming at time of writing.

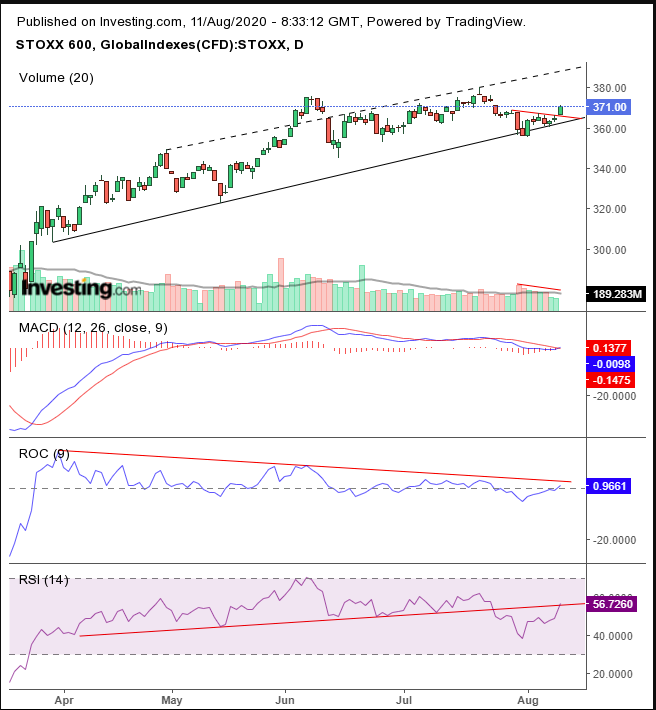
The Stoxx Europe 600 Index Index jumped at the open, hoisted by automobile manufacturers such as BMW (DE:BMWG) and Renault (PA:RENA) as well as travel and leisure stocks including International Airlines Group (LON:ICAG), cruise operator Carnival (LON:CCL) and InterContinental Hotels Group (LON:IHG), even after the latter posted a loss and halted its dividend.
STOXX 600 Daily
STOXX 600 Daily

Though the pan-European benchmark completed a H&S bottom on the hourly chart—on a rising gap, confirming the rising channel bottom support—volume faded and a slew of indicators faced resistance.

Earlier Tuesday, Asian indices were mostly green as foreign investors increased regional holdings of emerging markets assets for the second straight month. However, China’s Shanghai Composite was uncharacteristically depressed, (-1.15%), as the US-China relationship was back in focus ahead of a meeting between top trade officials to review the first six months of the Phase 1 trade deal.

On Monday, during the Wall Street session, stock performance was uneven as investors sold off some big gainers that had pushed equities to near-record highs. The S&P 500 Index closed a mere 0.76% from its Feb. 19 record.

At the opposite end of the spectrum, the NASDAQ fell 0.4% for the second consecutive day, for a total decline of 1.25%. This marks the tech-heavy benchmark’s first back-to-back selloff since May 13.

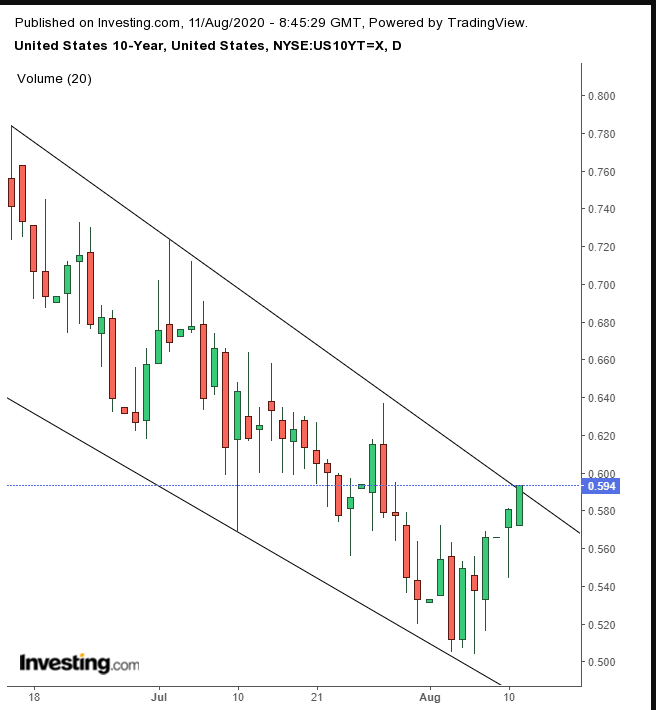
Yields, including for the 10-year Treasury note, reached their highest level since July 27.
UST 10Y Daily
UST 10Y Daily

Rates are struggling against the top of a falling channel.

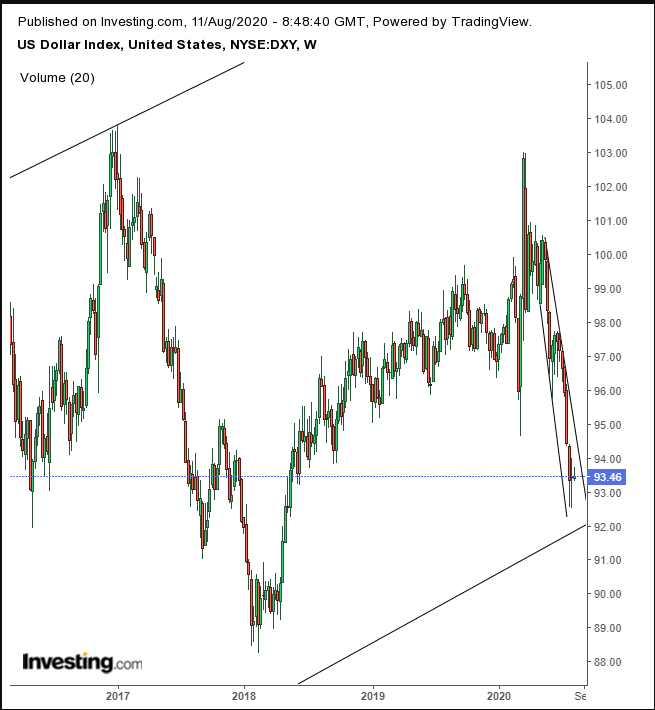
The dollar's three-day rally ran out of steam, erasing Monday’s gains.
DXY Weekly
DXY Weekly

Technically, the greenback’s churning for over a week underscores the importance of this technical vortex—where the downtrend from the March high meets with the uptrend since the 2008 bottom. The USD reached the bottom of a rising channel since 2009, visible in the chart above.

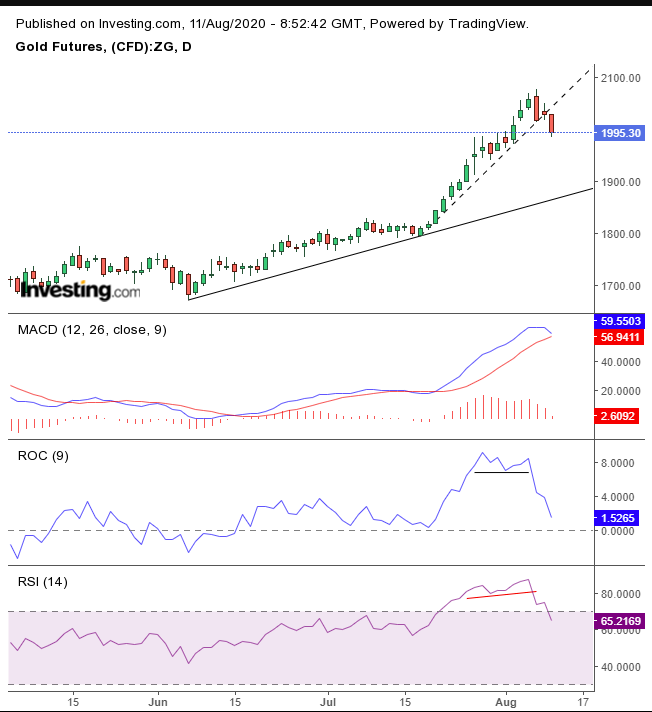
Gold lost over 2%. It was the second, sharp selloff for the yellow metal within three days, for a total decline of 3.4% and the worst slump since the March bottom.
Gold Daily
Gold Daily

Both the ROC and RSI momentum-based indicators topped out, while the price-based, lagging MACD appears about to be triggering a bearish cross—suggesting a sharper pullback toward the uptrend line, currently at $1,900.

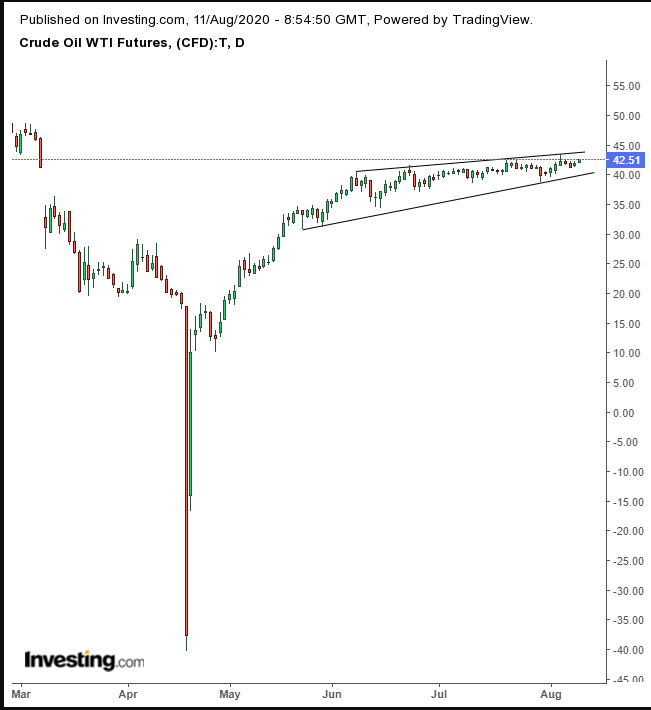
Oil climbed for a second day, crossing midway to $43 a barrel, its highest level since March 5.
Oil Daily
Oil Daily

WTI still seems to be trapped by the market dynamics following perhaps the worst falling gap in its history on March 9, which erased about a quarter of its value.

Up Ahead

Up Ahead

Stocks

  • The Stoxx Europe 600 Index increased 1.5%.
  • Futures on the S&P 500 Index advanced 0.4%.
  • Germany’s DAX gained 1.9%.
  • The MSCI Asia Pacific Index moved up 1%.

Currencies

  • The Dollar Index fell 0.2% to 93.46.
  • Sterling was little changed at 0.8981 per euro.
  • The Japanese yen weakened 0.2% to 106.20 per dollar.
  • The Turkish lira was flat at 7.2864 per dollar.

Bonds

  • The yield on 10-year Treasuries climbed less than one basis point to 0.58%.
  • The yield on two-year Treasuries was unchanged at 0.13%.
  • Britain’s 10-year yield gained one basis point to 0.14%.
  • Germany’s 10-year yield increased less than one basis point to -0.52%.

Commodities

  • West Texas Intermediate crude climbed 0.7% to $42.25 a barrel.
  • Gold weakened 1.1% to $2,004.78 an ounce.
  • Silver weakened 3.1% to $28.23 per ounce.
  • LME zinc sank 0.3% to $2,389 per metric ton.
Opening Bell: Stocks, Futures Rise On Lingering Stimulus Hopes; Gold Drops
 

Related Articles

FactSet Research Systems Inc
Podcast : Financial Market Preview - Friday 9-Jun By FactSet Research Systems Inc - Jun 09, 2023

US futures are indicating a slightly lower open. European equity markets have opened with some losses, following mostly positive Asian trade. Higher-than- expected US jobless...

Opening Bell: Stocks, Futures Rise On Lingering Stimulus Hopes; Gold Drops

Add a Comment

Comment Guidelines

We encourage you to use comments to engage with users, share your perspective and ask questions of authors and each other. However, in order to maintain the high level of discourse we’ve all come to value and expect, please keep the following criteria in mind: 

  • Enrich the conversation
  • Stay focused and on track. Only post material that’s relevant to the topic being discussed.
  • Be respectful. Even negative opinions can be framed positively and diplomatically.
  •  Use standard writing style. Include punctuation and upper and lower cases.
  • NOTE: Spam and/or promotional messages and links within a comment will be removed
  • Avoid profanity, slander or personal attacks directed at an author or another user.
  • Don’t Monopolize the Conversation. We appreciate passion and conviction, but we also believe strongly in giving everyone a chance to air their thoughts. Therefore, in addition to civil interaction, we expect commenters to offer their opinions succinctly and thoughtfully, but not so repeatedly that others are annoyed or offended. If we receive complaints about individuals who take over a thread or forum, we reserve the right to ban them from the site, without recourse.
  • Only English comments will be allowed.

Perpetrators of spam or abuse will be deleted from the site and prohibited from future registration at Investing.com’s discretion.

Write your thoughts here
 
Are you sure you want to delete this chart?
 
Post
Post also to:
 
Replace the attached chart with a new chart ?
1000
Your ability to comment is currently suspended due to negative user reports. Your status will be reviewed by our moderators.
Please wait a minute before you try to comment again.
Thanks for your comment. Please note that all comments are pending until approved by our moderators. It may therefore take some time before it appears on our website.
 
Are you sure you want to delete this chart?
 
Post
 
Replace the attached chart with a new chart ?
1000
Your ability to comment is currently suspended due to negative user reports. Your status will be reviewed by our moderators.
Please wait a minute before you try to comment again.
Add Chart to Comment
Confirm Block

Are you sure you want to block %USER_NAME%?

By doing so, you and %USER_NAME% will not be able to see any of each other's Investing.com's posts.

%USER_NAME% was successfully added to your Block List

Since you’ve just unblocked this person, you must wait 48 hours before renewing the block.

Report this comment

I feel that this comment is:

Comment flagged

Thank You!

Your report has been sent to our moderators for review
Continue with Google
or
Sign up with Email