- U.S. futures tumble as China's trade tariffs accusations spur risk off
- Pound hits 2016 flash-crash low as PM Johnson threatens general elections
- U.S. Treasury yields drops near 2016 levels ahead of Fedspeak
- WTI breaks below $55
Key Events
September trading for S&P 500, Dow and NASDAQ 100 futures started on the wrong foot this morning as investors struggled to find stability amid conflicting trade reports and signs of a global slowdown, while European and Asian stocks were hit by Brexit chaos and civil unrest in Hong Kong.
Meanwhile, the pound plunged to the lowest level since the 2016 “flash crash”, as British Prime Minister Boris Johnson threatened to call general elections for Oct. 14 if the Parliament voted a bill—before its forced closure on Sept. 9—to stop the “no-deal” Brexit he spearheaded.
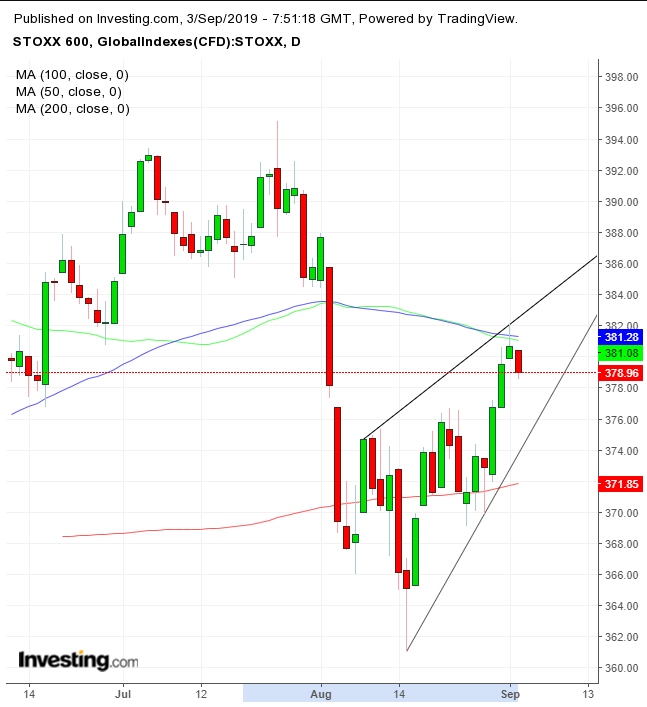
The STOXX 600 slid lower, ending a three-day advance, with mining and retail shares leading the losses.
Technically, the drop followed Friday’s shooting star, whose highs tested the top of a potential rising wedge, bearish after the 8.6% tumble from the July 25 highs to the Aug. 15 lows. The price also found resistance by the 50 and 100 DMAs, revealing further technical pressure atop the pattern.
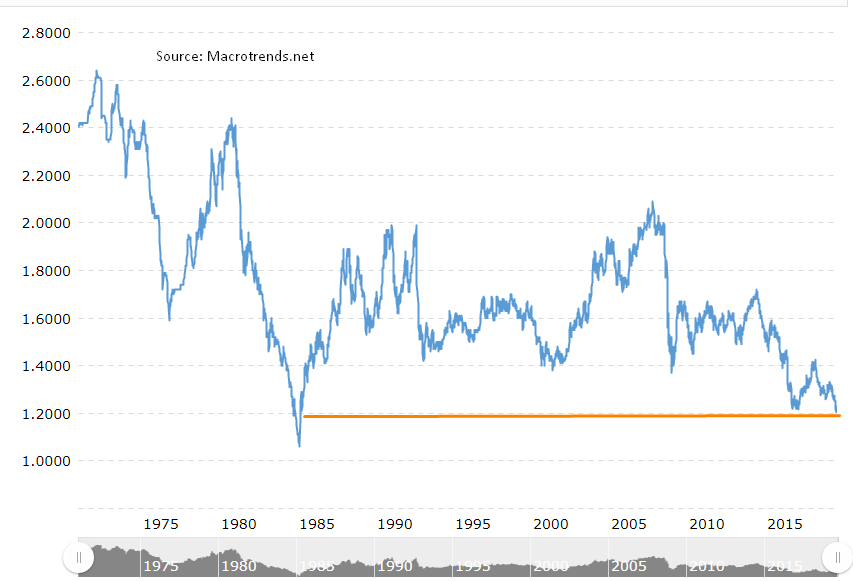
With the exception of 2016’s brief nosedive, the $1.2 level hit by cable on Tuesday was last seen in 1985.
In the earlier Asian session, most regional equities fell after reports China filed a complaint against the United States at the World Trade Organization, saying the U.S.’s latest tariff moves violated agreements reached in an Osaka meeting in June.
Hong Kong’s Hang Seng slid 0.39% as calls mounted for the city to return to British citizenship. At the opposite side of the spectrum, New Zealand’s S&P/NZX 50 outperformed (+1.43%) as companies with reliable dividends such as Contact Energy (NZ:CEN) and Meridian Energy (NZ:MEL) added to an outlook of low interest rates.
Global Financial Affairs
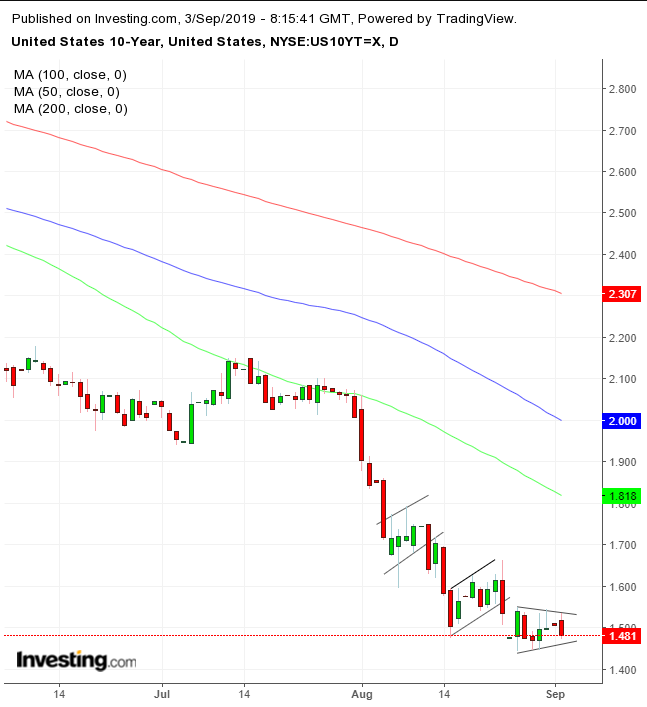
Meanwhile, yields on 10-year Treasurys slipped back below 1.5% to only 1 basis point above the Aug. 28 low—the most depressed level since July 2016. Technically, yields are developing a third back-to-back continuation pattern, each of whose downside breakout was the start of the follow-up bearish pattern.
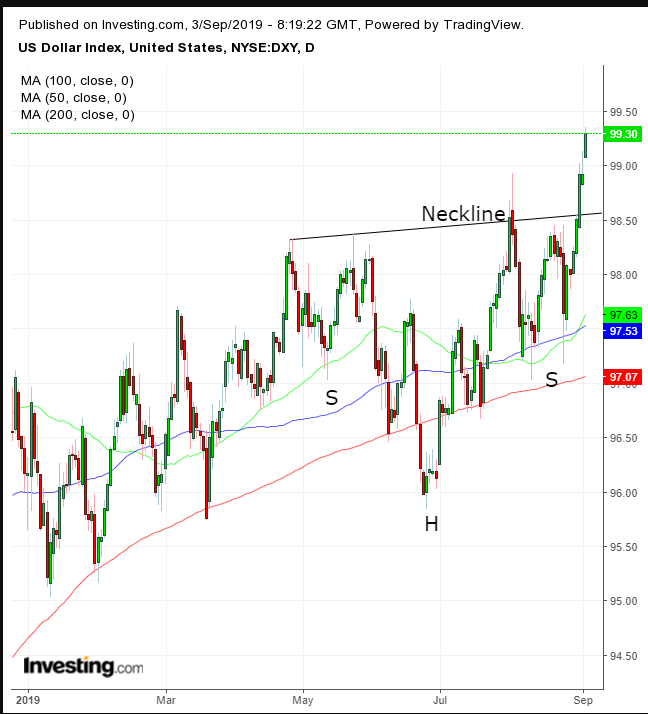
The Dollar Index inched higher for the fourth day out of five, hitting the highest price since May 11, 2017. Technically, the greenback completed a H&S continuation pattern, whose uptrend has been supported by the 200 DMA all year.
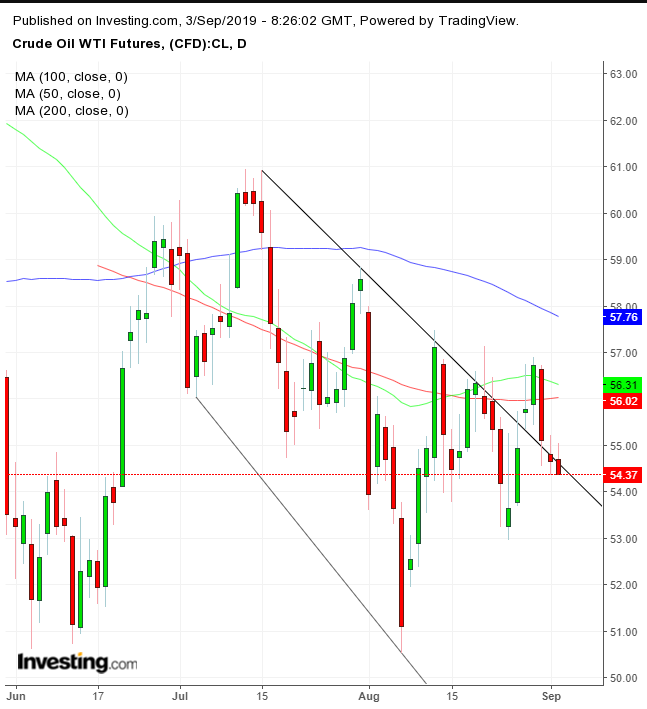
In commodities, oil extended Monday’s drop below $55 on renewed fears a global slowdown would depress demand. Technically, the price ticked lower for a third session after it tested the 200 DMA, back into a falling channel.
Up ahead
- British MPs start discussions on an emergency plan to take control of the legislature’s business on Tuesday evening in London.
- Final euro-area PMI data for August are due on Wednesday.
- Fed speakers include New York Fed’s John Williams on Wednesday and Fed Chair Jerome Powell on Friday.
- The U.S. jobs report on Friday is projected to show the widely-watched nonfarm payrolls rose by 158,000 in August, versus 164,000 the month prior. Estimates are for unemployment to be steady at 3.7% and the average hourly earnings rate of increase to slow to 3.0%.
Market Moves
Stocks
- The MSCI Asia Pacific Index dropped 0.3%.
Currencies
- The Dollar Index advanced 0.34%.
- The euro slid 0.3% to $1.0942.
- The British pound tumbled 0.7% to $1.1981.
- The Japanese yen strengthened 0.1% to 106.09 per dollar.
- The MSCI Emerging Markets Currency Index fell 0.4%.
Bonds
- The yield on 10-year Treasurys slid one basis point to 1.49%.
- The yield on2-year Treasurys dropped one basis point to 1.49%.
- Britain’s 10-year yield slipped six basis points to 0.382%.
Commodities
- West Texas Intermediate crude fell 1.1% to $54.57 a barrel.
- Copper tumbled 1.6% to $2.51 a pound.
- LME nickel advanced 1.4% to $18,105 per metric ton.
