- 3-month and 10-year yields invert for the first time since 2007
- Pessimistic Fed maintains rates, downgrades economic outlook
- Small caps underperform on reduced inflationary pressure, potentially indicating a market top
- Gold signals risk off, adds to worries of market top
Market shocks just keep coming, after investors, as well as U.S. President Donald Trump, received something they've been wanting for some time now, a dovish Fed. However, it's been achieved at a price that's weighed on markets, which could easily continue into the coming trading week.
It started with Thursday's pessimistic Fed; the central bank downgraded U.S. growth expectations, reduced its inflation outlook and indicated they're not likely to increase rates in 2019. On Friday 10-year Treasury yields plunged below 3-month yields on renewed fears of an economic slowdown. It's the first time since 2007 the yield curve has inverted. Finally, to cap off the week, U.S. equities tumbled, wiping out all gains for the week and finishing lower.
Worst Equity Selloff Since January
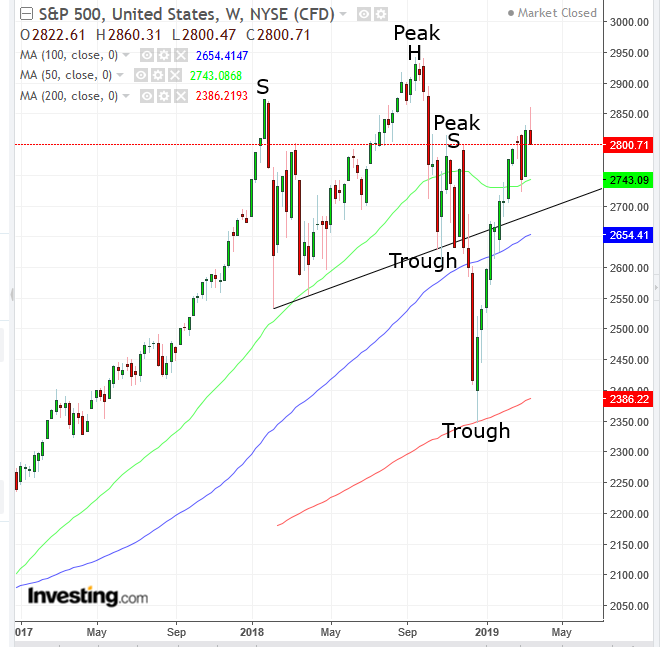
The S&P 500 dropped 1.9% on Friday, the worst daily selloff since January 3rd when the benchmark index plunged 2.48%. All sectors but defensive-Utilities (+0.72%) were in the red.
Financials (-2.76%), whose listed companies will see a diminished growth outlook as long as interest rates remain low with rates, and Energy sector shares (-2.7%), which tracked oil prices lower, led the selloff. For the week, the popular index retraced 0.77% of its gains from the highest levels since the December bottom.
Financials (-4.84%) underperformed, falling more than double the runner-up, Materials (-1.93%), which sank on drawn-out U.S.-Sino trade talks. The third worst performer, Healthcare fell 1.49% on the week, with Industrials close behind, down 1.41% pressured by the unresolved trade talks and the dollar hovering within 1-percent of its highest level since mid-2017.
Technically, while the SPX is still in an uptrend, it's a landmine. On the daily chart, the 50 DMA is approaching the 200 DMA to form a golden cross, while the RSI is threatening a double-top. On the weekly chart, last week's trading formed a shooting star, with a divergent RSI which tracked lower peaks and troughs—suggesting the price is potentially creating a massive H&S top ranging through January 2018—but which may have provided an upside breakout to a descending channel.
The Dow Jones Industrial Average fell 1.77% on Friday, the most for the 30-component, large cap index since January 3rd's 2.85% selloff. Like the S&P, gains made during the week were wiped out, and the index closed down 1.34%.
It's noteworthy that the Dow fared better than the SPX even amid the ongoing trade dispute and the big hit to financials. Financials make up 18.24% of the Dow, almost 5% more than the S&P 500's 13.7%. Perhaps, the outlook for lower inflation (more on that below) provided a tailwind for mega caps, but that's to argue against the headwind of dollar's current strength which would hurt exports, a key source of revenue for Dow companies.
The NASDAQ Composite plunged on Friday, plummeting 2.5%, its worst slide since Dec. 21, when it lost 2.99%. For the week, the tech-heavy benchmark outperformed, falling only 0.6%. Technically, the index followed the SPX pattern of, on the one hand, potentially nearing a golden cross on the daily chart, while momentum topped out, forming a shooting star on weekly trade. It's also potentially forming a massive H&S pattern ranging from Jan. 2018. However, the NASDAQ's picture may be bleaker, as its RSI descending channel has not been breached.
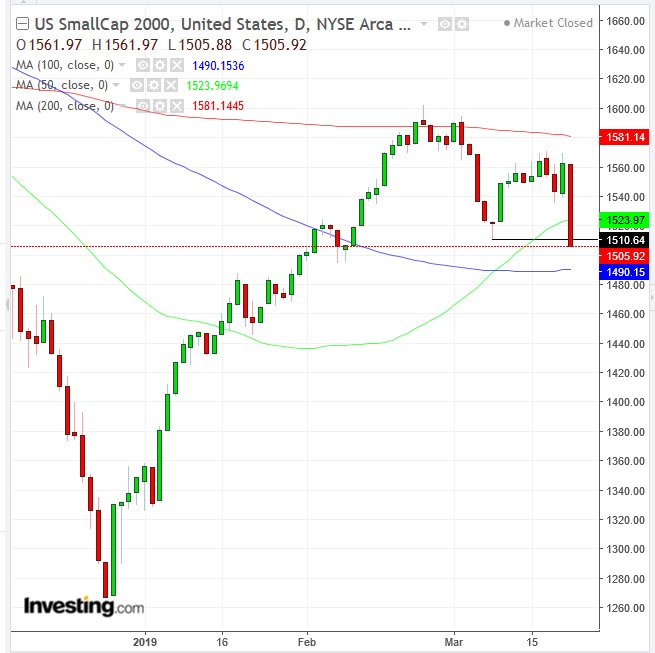
The Russell 2000 lost 3.61% of value on Friday, its worst day since Dec. 3 when it plunged 4.46%. It was the obvious underperformer, lagging behind the NASDAQ by almost a-percent-and-a-half. The small-cap index also underperformed on a weekly basis, falling 3.07%.
Technically, after Friday's slip, small caps are in the most precarious position, having fallen below the March 8 trough, satisfying a short-term reversal, at least by some technicians' estimation (stricter analysts would not count the Feb. peak as part of the descending sequence, as it was part of the uptrend; they would need to see two separate, falling peaks). The price fell below the 50 DMA, the MACD’s shorter MA confirming resistance and the RSI posting a lower trough in momentum.
It may also be noteworthy that a typical market top is characterized by a selloff of small caps, as investors unload the more speculative shares within their portfolios first.
Yields Invert; Recession To Follow?
Since we noted the potential double-top of the U.S. 10-year Treasury note yield in early November 2018, which was confirmed in late November, we've been warning about falling yields. When yields fell below their uptrend line since the June 2016 bottom, we discussed the overall rate breakdown manifested in the death cross, when the 50 DMA crossed below the 200 DMA amid the formation of triangular congestion, and finally, the pennant formation that triggered the symmetrical triangle's breakout.
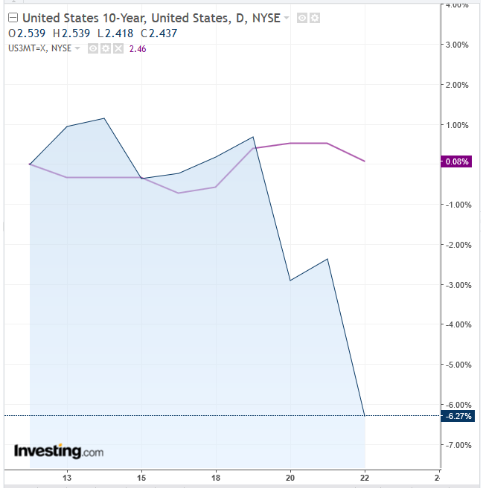
Even as equities were roaring, we often pointed out the relationship between 2-year and 10-year yields as the spread between the two progressively narrowed. This odd combination is what made us leery of trusting this year's exuberant stock rally.
On Friday the The 10-year yield fell to 2.437, slipping below the 3-month yield of 2.462. This is an even stricter benchmark for recession, used by the staunchest money-managers, as it has the highest reliability of leading a recession. The last time this inversion occurred was in 2007. It was followed by the worst market crash and economic recession in a generation.
Another indicator of risk-off is gold. The yellow metal has now climbed for three straight weeks.
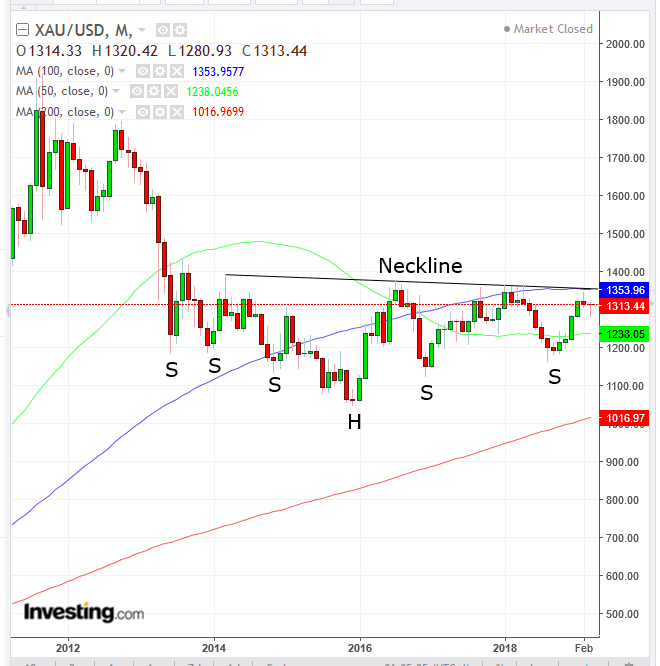
What investors should pay attention to, however, is that the precious metal rose even when the dollar strengthened for two of those three weeks. In this case, clearly, gold's rise is not a result of dollar weakness but rather its status as shelter ahead of a storm.
This narrative is in perfect sync with falling yields and Friday's yield curve inversion.
Technically, gold might be gearing up to cross the 100-month MA for the first time since May 2016, which could be the catapult for a massive complex H&S bottom, ranging since mid-2013. The question is whether this H&S would be symmetrical, thereby calling for a third shoulder, to match its left side.
Though this pattern is not always symmetrical, market fluctuations amid severe reversals may call for another dip in gold before bulls are ready to cross over the $1,400 level.
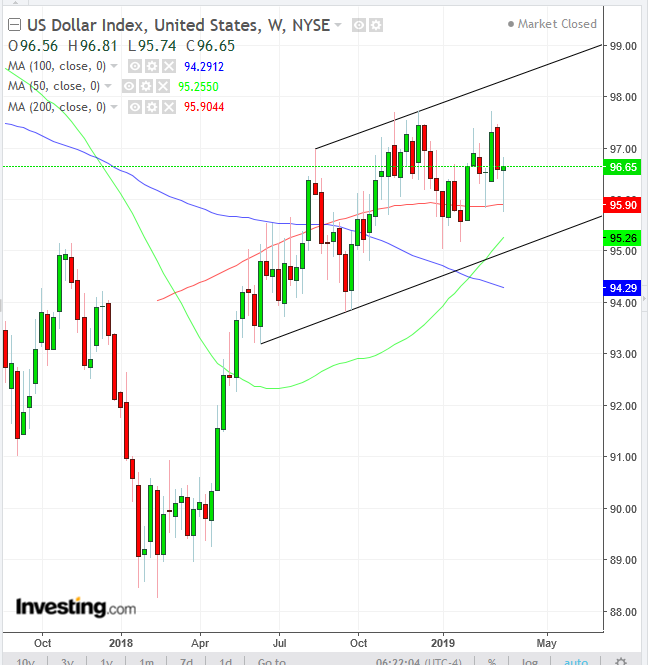
The dollar rebounded strongly, finding support by the 200-week MA, as the 50-week MA heads toward a golden cross, near the bottom of an ascending channel. This paves the way for a continued uptrend.
How does this jibe with a dovish Fed and all that entails? Perhaps it doesn't. Rather it suggests dollar bulls are not convinced. Maybe the USD strength is due to its status as a safe haven, as demand for Treasurys surges.
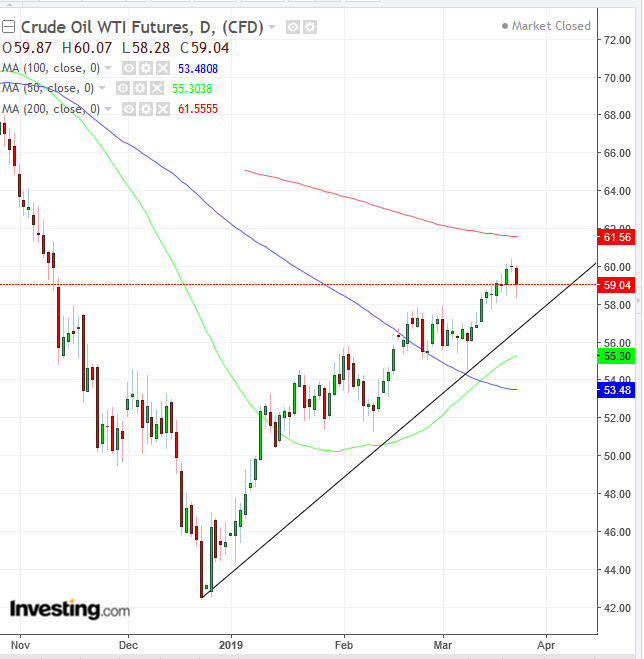
Oil prices took a hit with the outlook for a contracting economy, which slows or even ends investment, construction and transportation of goods. Technically, oil is in a clear uptrend. The price found resistance beneath the 200 DMA.
Week Ahead
All times listed are EDT
Monday
5:00: Germany – IFO (March): business climate index to rise to 98.7 from 98.5.
8:30: U.S. – Chicago Fed National Activity Index (February): forecast to rise to -0.25 from -0.43.
Tuesday
3:00: Germany – GfK Consumer Confidence (April): expected to remain at 10.8.
8:30: U.S. – Housing Starts and Building Permits (February): starts to fall to 1.218 million from 1.230 million MoM and permits to decrease 1.3% MoM.
Wednesday
8:30: U.S. – Trade Balance (January): deficit to fall to $57.50 billion from $59.80 billion.
10:30: U.S. – EIA Crude Inventories (w/e 22 March): stockpiles expected to rise 0.309 million after they fell by 9.6 million barrels a week earlier.
Thursday
8:30: U.S. – GDP (Q4, final): forecast to rise by 2.4% from 2.6% QoQ.
9:00: Germany – CPI (March): CPI to remain flat at 1.5% YoY from 1.5%.
19:30: Japan – Unemployment Rate (February): to remain flat at 2.5%.
Friday
4:55: Germany – Unemployment Rate (March): rate to edge down to 4.9% from 5%.
5:30: UK – GDP (Q4, final): growth expected to be 1.3% YoY and 0.2% QoQ.
8:30: U.S. – Personal Income (February): forecast to grow 0.3% MoM.
9:45: U.S. – Chicago PMI (March): expected to fall to 61.8 from 64.7.
10:00: U.S. – New Home Sales (February): expected to rise 1.3% MoM.

