* Trump steps up rhetoric on North Korea
* Measure of global stock market cap drops $1 trillion this week
* Yen touches four-month high vs dollar
By Rodrigo Campos
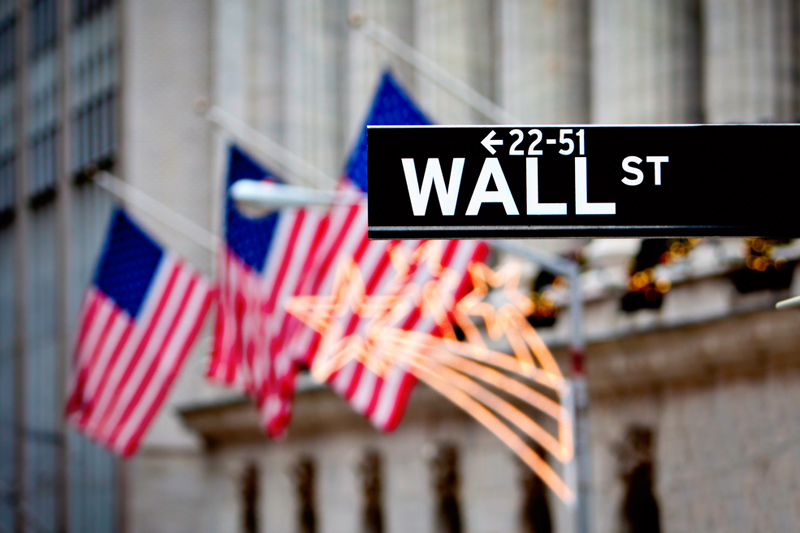
NEW YORK, Aug 11 (Reuters) - Wall Street put a floor under global equities on Friday after a weak inflation reading brought investors back into U.S. stocks even as tensions between the United States and North Korea continued to escalate, though that tension still drove safe-haven buying of gold and the yen.
A small rise in a measure of U.S. consumer prices pointed to benign inflation that could make the Federal Reserve cautious about raising interest rates again this year, which would be favorable to equity investors.
The hope that the Fed will have to slow its rate-hike path appeared to stop, at least for now, the near $1-trillion loss in world stocks valuations this week triggered by the war of words between Pyongyang and Washington.
"The slight bias to the upside (in stocks) is a result of the CPI number. The market is interpreting it as lowering the odds of the Fed raising rates in December," said Keith Lerner, chief market strategist at SunTrust Advisory Services in Atlanta.
Reuters data show a 22 percent perceived chance for a rate hike after the Fed's December meeting.
Japanese markets were closed for a holiday, but the tense mood dragged Asian shares lower and an MSCI index of stocks across the globe .MIWD00000PUS posted its largest weekly drop since the week before Donald Trump won the U.S. presidential election in November.
Trump issued a new warning to Pyongyang on Friday, saying in a tweet: "Military solutions are now fully in place, locked and loaded, should North Korea act unwisely." Korea had responded to Trump's previous promise to unleash "fire and fury" with a threat to land missiles near the U.S. Pacific territory of Guam. Dow and S&P 500 inched higher on the day but they both posted their largest weekly percentage drops since late March.
"There's not a great incentive to buy big," said Lerner of SunTrust Advisory. "You're less than 2 percent off the high for the S&P heading into a weekend where uncertainty with North Korea still lingers."
The Dow Jones Industrial Average .DJI rose 14.31 points, or 0.07 percent, to end at 21,858.32, the S&P 500 .SPX gained 3.11 points, or 0.13 percent, to 2,441.32 and the Nasdaq Composite .IXIC added 39.68 points, or 0.64 percent, to 6,256.56. pan-European FTSEurofirst 300 index .FTEU3 lost 1.01 percent and MSCI's gauge of stocks across the globe .MIWD00000PUS shed 0.26 percent for a weekly loss of 1.6 percent, the largest since the week to Nov. 4.
Emerging market stocks .MSCIEF lost 1.27 percent. MSCI's broadest index of Asia-Pacific shares outside Japan .MIAPJ0000PUS closed 1.47 percent lower.
South Korea's KOSPI .KS11 fell 1.7 percent on Friday to its lowest since May 24, but its losses for the week were a relatively modest 3.2 percent.
"Pretty remarkable, perhaps even extraordinary, considering," said Tim Ash, strategist at fund manager BlueBay.
A Reuters Datastream index of more than 7,000 stocks across the globe saw its market capitalization drop from a record high $61.36 trillion on Monday to $60.43 trillion at the close on Thursday.
Many world stock markets have hit record or multi-year highs in recent weeks, leaving them vulnerable to a selloff, and the tensions over North Korea proved to be the trigger.
The yen on Friday added to a strong weekly rally against the dollar of close to 1.5 percent, hitting its highest versus the greenback in almost four months, at 108.73 yen. yen tends to benefit during times of geopolitical or financial stress as Japan is the world's biggest creditor nation and there is an assumption that Japanese investors will repatriate funds should a crisis materialize.
The Korean won KRW=KFTC continued to fall versus the dollar, down 0.13 percent to 1,143.5 on Friday for a 1.6 percent decline on the week.
The dollar was further weighed down on Friday by the soft U.S. inflation data. the data continues to come in on the softer side, the market might start to price the Fed staying on hold this year," said Sireen Harajli, FX strategist at Mizuho in New York.
The dollar index .DXY fell 0.32 percent, with the euro EUR= up 0.42 percent to $1.1819.
Sterling GBP= was last trading at $1.3007, up 0.25 percent on the day.
The Japanese yen last strengthened 0.03 percent versus the greenback at 109.22 per dollar JPY= .
In bond markets, the yield on U.S. Treasuries fell, also pressured by the lowered expectations for a Fed move. are four more (inflation) prints between now and the December FOMC meeting and we expect the Fed to remain data-dependent, if a touch more cautious," TD Securities said in a research note.
Benchmark U.S. 10-year notes US10YT=RR last rose 6/32 in price to yield 2.1905 percent, from 2.211 percent late on Thursday.
The 30-year bond US30YT=RR was last up 4/32 in price to yield 2.7871 percent, from 2.794 percent late on Thursday.
After touching a more than two-month high at $1,291.86, spot gold XAU= last added 0.2 percent to $1,288.81 an ounce. Its weekly gain of 2.6 percent is the largest since June 2016.
Ongoing global glut concerns lingered in oil markets despite a bigger-than-expected draw in U.S. crude inventories, leaving prices volatile.
U.S. crude CLcv1 rose 0.41 percent to $48.79 per barrel and Brent LCOcv1 was last at $52.01, up 0.21 percent. "Fear and fury" costs global markets $1 trillion
http://reut.rs/2fxcDUH World FX rates in 2017
http://tmsnrt.rs/2egbfVh Global assets in 2017
http://reut.rs/1WAiOSC Global bonds dashboard
http://tmsnrt.rs/2fPTds0 Global market cap
http://reut.rs/2mcp7T1 Emerging markets in 2017
http://tmsnrt.rs/2ihRugV
^^^^^^^^^^^^^^^^^^^^^^^^^^^^^^^^^^^^^^^^^^^^^^^^^^^^^^^^^^^>
