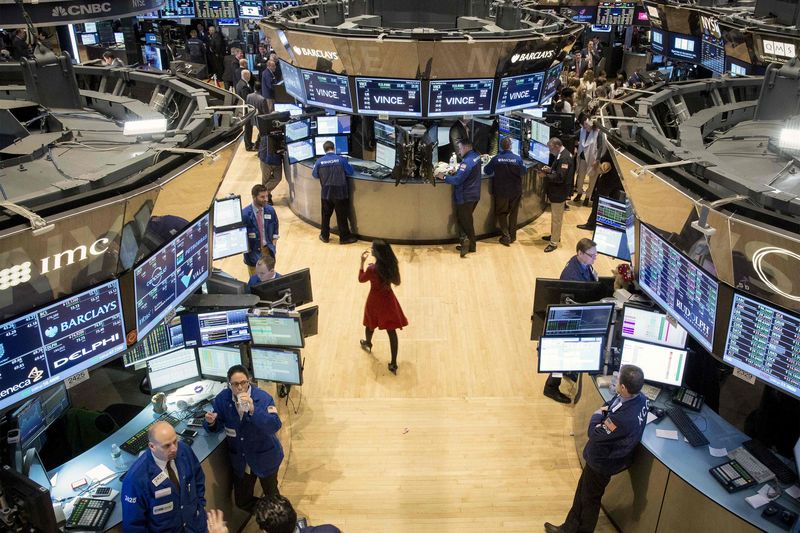
* MSCI gauge of world stocks touches intraday record high
* Brent, WTI bounce from 2 pct intraday drops
* Dollar index holds most of Friday's sharp gains
By Rodrigo Campos
NEW YORK, Aug 7 (Reuters) - A broad measure of equity markets across the world climbed to a record high on Monday, boosted by gains in Asia, while U.S. and European markets were little changed, with U.S. energy shares capping gains on the benchmark S&P 500 index.
Oil prices fell, pressured over the past several days after last week climbing to their highest since May, as OPEC exports hit a record peak last month and output rose to a 2017 high. However, both U.S. crude and Brent settled far from their session lows.
Strong economic data globally and healthy corporate earnings in the United States have supported equities, with the Dow industrials closing Friday at an eighth consecutive record high.
"I have seen a lot of companies exceeding their revenue growth and we also have better-than-expected global growth, which are the main drivers for equities," said Kim Forrest, senior equity research analyst at Fort Pitt Capital Group in Pittsburgh.
The Dow Jones Industrial Average .DJI rose 15.41 points, or 0.07 percent, to 22,108.22, the S&P 500 .SPX gained 3.01 points, or 0.12 percent, to 2,479.84 and the Nasdaq Composite .IXIC added 30.45 points, or 0.48 percent, to 6,382.02.
MSCI's gauge of stocks across the globe .MIWD00000PUS gained 0.25 percent and was on track to close at a record high. The pan-European FTSEurofirst 300 index .FTEU3 lost 0.12 percent.
Emerging market stocks gained 0.65 percent. MSCI's broadest index of Asia-Pacific shares outside Japan .MIAPJ0000PUS closed 0.5 percent higher, while Japan's Nikkei .N225 rose 0.52 percent.
OIL EYES OPEC
Oil prices fell, with energy markets focused on comments from OPEC and non-OPEC officials meeting in Abu Dhabi to discuss ways to boost compliance with a deal to cut output.
Production at Libya's Sharara field was returning to normal after a brief disruption by armed protesters.
U.S. crude CLcv1 fell 0.48 percent to $49.34 per barrel and Brent LCOcv1 was last at $52.27, down 0.29 percent on the day.
"The petroleum markets are tipping toward the lower end of their recent trading range as oil producers meeting in Abu Dhabi have been slow to assure the market that compliance with this year's production cuts will be improved, although we continue to note that adherence to the limits has actually been quite strong by historical standards," Tim Evans, Citi Futures' energy futures specialist, said in a note.
In currency markets, the U.S. dollar edged lower but held onto most of Friday's gains as investors await inflation data this week that may signal a turnaround in the greenback's weakness this year.
"We have a view that the U.S. dollar is due for some mild corrective strength in the near-term and we see some confirming price action from some of the key G10 currency pairs," said Erik Nelson, currency strategist at Wells Fargo (NYSE:WFC) Securities in New York.
"Some of these dollar-bloc currencies are starting to show signs of maybe rolling over in the near-term."
The dollar index .DXY fell 0.12 percent, with the euro EUR= up 0.22 percent to $1.1794.
The Japanese yen weakened 0.03 percent versus the greenback at 110.74 per dollar, while sterling GBP= was last trading at $1.303, down 0.04 percent on the day.
In the absence of major U.S. economic data, the Treasuries market was little changed and focused on a heavy schedule of government and corporate bond issues this week, which could push yields higher.
Benchmark 10-year notes US10YT=RR last rose 3/32 in price to yield 2.2584 percent, from 2.269 percent late on Friday.
The 30-year bond US30YT=RR last rose 4/32 in price to yield 2.8374 percent, from 2.844 percent.
Spot gold XAU= rose 0.04 percent to $1,258.33 an ounce. U.S. gold futures GCcv1 fell 0.06 percent to $1,263.90 an ounce.
Copper CMCU3 rose 0.73 percent to $6,418.50 a tonne.
<^^^^^^^^^^^^^^^^^^^^^^^^^^^^^^^^^^^^^^^^^^^^^^^^^^^^^^^^^^^ Global assets in 2017
http://reut.rs/1WAiOSC Global currencies vs. dollar
http://tmsnrt.rs/2egbfVh Global bonds dashboard
http://tmsnrt.rs/2fPTds0 Emerging markets in 2017
http://tmsnrt.rs/2ihRugV
^^^^^^^^^^^^^^^^^^^^^^^^^^^^^^^^^^^^^^^^^^^^^^^^^^^^^^^^^^^>
