- U.S. futures climb on mounting Fed rate cut expectations
- Treasurys, gold and yen gain ground
- WTI spikes on reported tank attacks
- U.S. tech stocks take a hit from Goldman Sachs warnings, fresh Facebook headwinds
- The race to pick a successor to British Prime Minister Theresa May heats up on Thursday, with the first Conservative Party leadership ballot.
- Also on Thursday, euro-area finance ministers meet in Luxembourg. On the agenda: financial penalties for Italy over its debt load and the euro-area budget.
- U.S. Industrial production and retail sales data on comes out on Friday
- China also releases factory output and retail sales on Friday.
- The U.K.’s FTSE 100 increased 0.1%.
- The MSCI Emerging Market Index fell 0.4%.
- The MSCI Asia Pacific Index dropped 0.5%.
- The Dollar Index fell 0.7%.
- The euro gained 0.1% to $1.1296.
- The British pound slid 0.1% to $1.268, the weakest in more than a week.
- The Japanese yen climbed 0.1% to 108.35 per dollar.
- The yield on 10-year Treasurys dropped one basis point to 2.11%.
- Germany’s 10-year yield fell one basis point to -0.25%.
- Britain’s 10-year yield slid three basis points to 0.833%, the biggest fall in a week.
- West Texas Intermediate crude gained 2.6% to $52.48 a barrel.
- Gold increased 0.3% to $1,337.14 an ounce.
Key Events
Futures on the S&P 500, Dow and NASDAQ 100 were off to a mixed open this morning, as the unresolved U.S.-China tariff dispute collided with dismal U.S. inflation figures, which strengthened the case for an interest rate cut from the Fed. However, prices later edged higher, probably boosted by a strong rebound in oil, which looked poised to bolster energy stocks.
The STOXX 600 opened lower for the second day, after nearing the May 16 peak. The pan-European index also bounced back later in the morning, with telecoms pushed higher by Germany's 5G spectrum final auction.
In the earlier Asian session, Japan’s Nikkei 225 (-0.57%) underperformed, dragged down by chip-related shares battered after their U.S. counterparts fell as the trade war turned sentiment gloomy.
Hong Kong’s Hang Seng (+0.01%) pared a 1.7% drop, as civil protests eased after authorities delayed a controversial extradition bill.
Global Financial Affairs
In yesterday’s U.S. session, tech led a widespread but small decline after fresh data showed U.S. core inflation—a closely watched measure—cooled down in May. Prices for goods excluding volatile food and energy rose 2% year-on-year, falling short of the 2.1% consensus. A rebound in food prices was cancelled out by cheaper gasoline prices. Although the languishing inflation bolsters the case for a Fed cut, investors may have overplayed their hand, pricing in a 98% chance of a cut this year. Notably, Goldman Sachs (NYSE:GS) analysts expect no Fed cut this year.

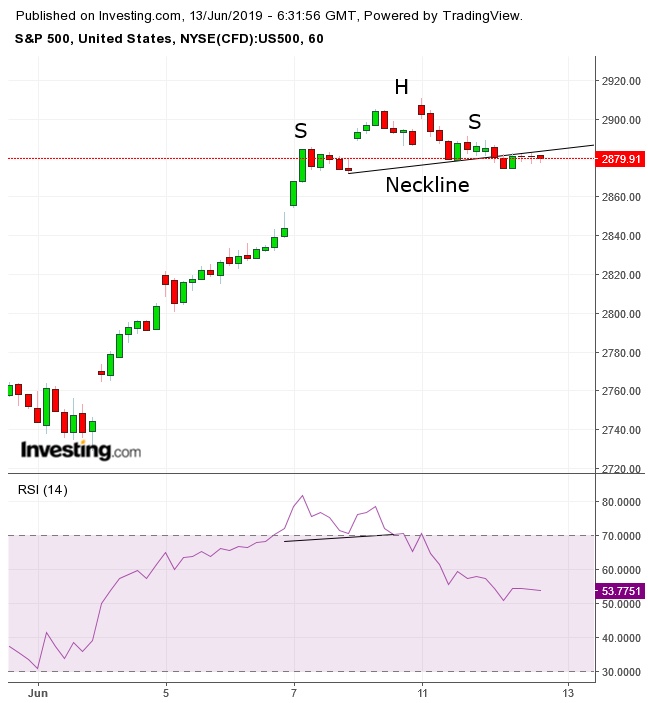
The S&P 500 (-0.21%) slipped for the second day, confirming our warnings of the last three days. In yesterday’s trading, the price completed a Head-and-Shoulders top on the hourly chart, confirmed with a double top in momentum, suggesting continued declines.
Meanwhile, Goldman Sachs also warned investors that if the U.S. Department of Justice decides to go after Facebook (NASDAQ:FB), Amazon (NASDAQ:AMZN) and Google’s Alphabet (NASDAQ:GOOGL), these companies' stocks could take a harsh beating, especially considering how high they are trading even amid a shrinking market. The investment bank pointed to Microsoft (NASDAQ:MSFT) as a good example of how shareholders suffered, as the stock kept falling even after the group settled with the government.
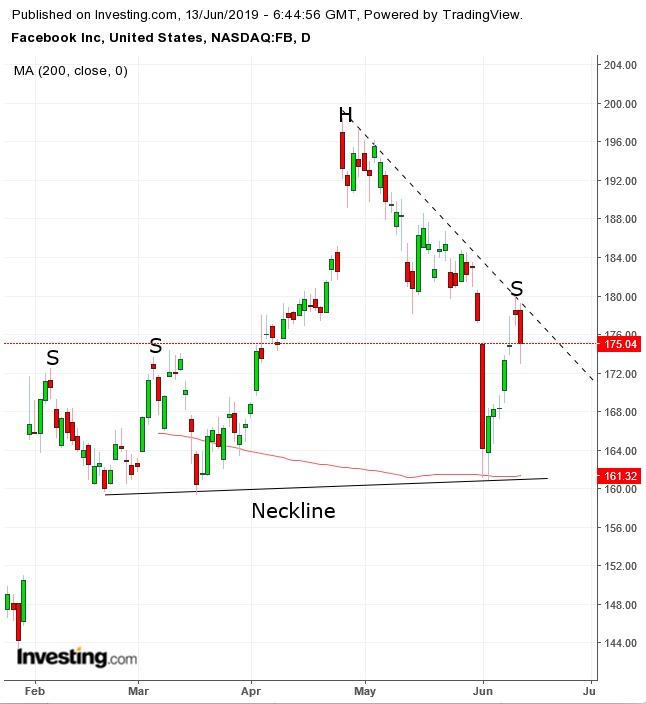
Adding fuel to the fire, a Wall Street Journal report unearthed emails showing that Mark Zuckerberg may have been aware of his company’s privacy abuse, sending FB stock 1.72% lower on Wednesday.

The stock price fell according to its downtrend line since April 25. If the price continues to drop with the downtrend line, it will slide below the trendline tracking the lows since Feb. 21, completing a H&S top. Notice that the neckline’s significance is reinforced by the 200 DMA. When a price falls below a top neckline, it is expected to keep falling.
Risk off pushed investors back into Treasurys. While demand for U.S. bonds rose with equities lately, because of the outlook of falling rates, now they are climbing on their safe-haven status, as stocks edge lower and the yen and gold gain ground. Technically, yields on 10-year notes are struggling against the underside of a rising flag. A breakout would suggest a continued downtrend for yields—an omen for equities.

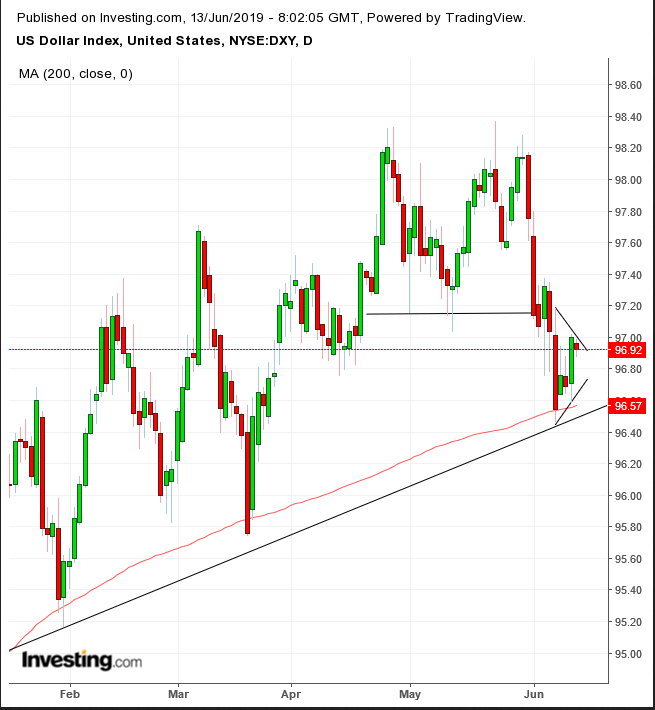
Falling yields dragged the dollar lower, after it rebounded from yesterday's weak inflation report. Technically, the USD is caught between conflicting forces. The double top likely increased sell orders. However, the price found support by the uptrend line since Sep. 2018, whose significance is underlined with the 200 DMA. This conflict has resulted in a pennant pattern, whose contracting trading demonstrates equal eagerness by both buyers and sellers. A breakout would likely catapult prices outside the range.

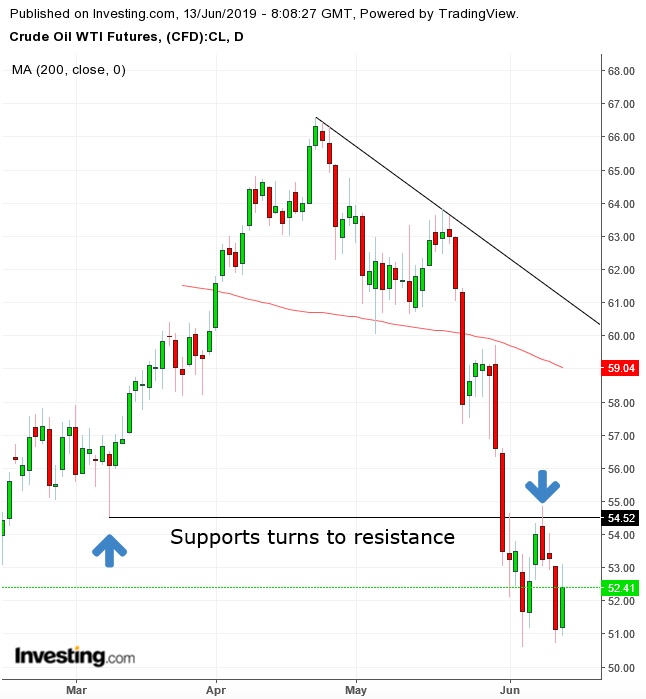
WTI rebounded forcefully on reports of attacks on oil tankers in the Gulf of Oman. Earlier, prices had tumbled to almost a five-month low on new evidence of rising U.S. stockpiles. The continued increase in supply shows falling demand—though some new analysis from BP (LON:BP)'s annual energy review seem to show a different backdrop—with investors worrying the trade war will halt economic expansion, and, with it, demand for energy used to build infrastructure.
However, after we have been bearish on oil for a while, WTI may have now been oversold, as it dropped 3% yesterday, for a 22% slide since late April. The RSI has reached 20—its most oversold condition since November 2018. At the time, the price proceeded to climb 55% over the following 5 months. While we don’t expect that kind of recovery, we do expect a correction. A close above the June 10 high—which found resistance at the lows of March—would complete a small double-bottom, potentially catapulting prices back toward their downtrend line, at $59 at the current angle, where they also meet with the 200 DMA.
Up Ahead
Market Moves
Stocks
Currencies
Bonds
Commodities
