The Organization of the Petroleum Exporting Countries (OPEC), and its oil-producing country peers, recently announced their intention to cut production in May 2023 and for the remainder of the calendar year. Against the backdrop of a global economy exhibiting tepid growth due to elevated inflation and rising consumer uncertainty; an increase in energy costs will adversely impact the economic outlook for 2023.
A look at energy costs
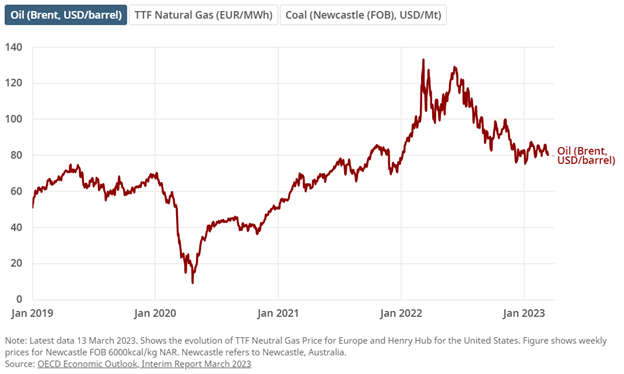
As noted in the OECD’s March 2023 Economic Outlook Interim Report, though the Russia-Ukraine war led to a wide-spread increase in global energy, since the beginning of the calendar year, energy costs have been relatively muted – but still above their pre-war levels. While the decline in oil from a peak of $130 to $80 has had a material impact on global purchasing power, by way of lower energy costs, a gradual increase will exacerbate an already tenuous economic environment and potentially further dampen global economic output.
Cut in production by OPEC: A look at the implications of this shift
Historically, a cut in production by OPEC would be done with hesitancy, as it would create an opening for U.S. shale producers. However, the recent developments with regional banks has lessened the ability of shale producers to quickly get the financing needed to increase production.
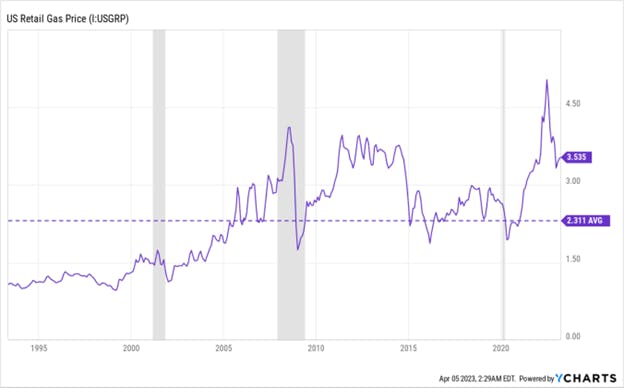
With OPEC instituting an output reduction, one of the seminal ways it will manifest for consumers is at the gas pump. As we approach the summer months of the 2023 calendar year, driving activity – particularly in North America – is expected to increase. And while the price of gas has come down from its recent high, it remains above its long-run average price.
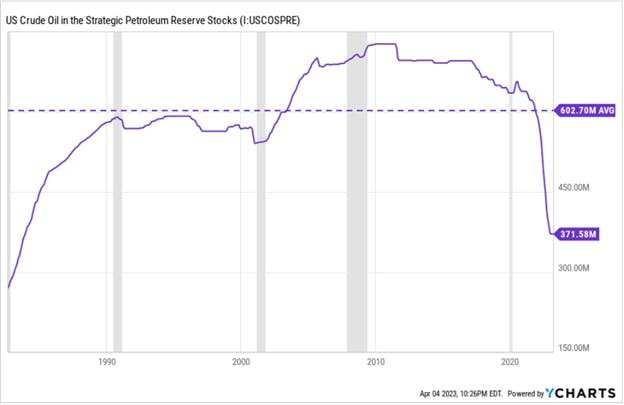
Taking a broader look, the timing of this OPEC output reduction is inopportune for the Biden Administration, as 26 million barrels of crude oil were approved for release from the Strategic Petroleum Reserve (SPR) in February 2023; this is in addition to the 180 million barrels that were sold last year to combat fuel prices that had risen on Russia's war on Ukraine and as global consumers emerged from the COVID-19 pandemic. This is important to note, as any temporary relief consumers could expect or anticipate due to a spike in gas prices over the coming months may not occur, as the SPR is currently at a historically low level and in need of replenishment.
When thinking of Oil, think Commodities
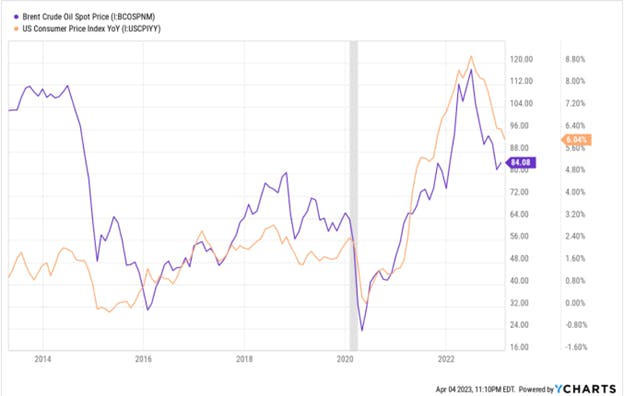
Oil is a commodity, and as mentioned in a previous article, there are two primary ways commodities benefit investors, (i) as a hedge against inflation and (ii) as a portfolio diversifier. In looking at the historical pricing data for Brent Crude Oil over time, there is clear evidence of the positive correlation between inflation and commodities; as oil prices have moved in tandem with inflation. Furthermore, the correlation matrix contrasting the performance of the S&P GSCI Brent Crude TR USD, a benchmark for investment performance in the Brent crude oil market, versus the S&P 500 TR Index (US Equity proxy) and Bloomberg US Aggregate Bond Index TR (US Fixed Income proxy) highlights the below-average to negligible relationship that exists between oil and the other two asset classes.
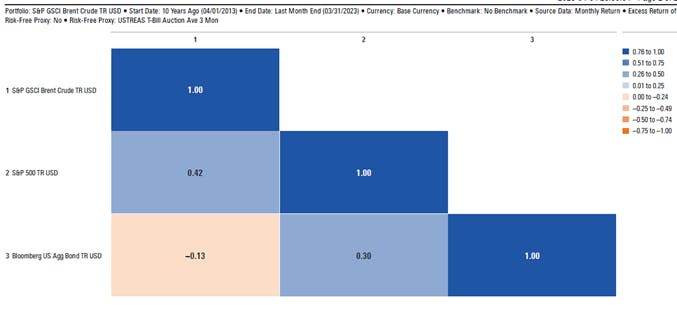
For businesses involved in commodities, as the cost of said commodity increases, it is passed along the development value chain and ultimately reflected in the prices of said products. For investors that have exposure to commodities (or associated businesses) within their portfolio - the strong pricing power they possess allows them to mitigate the effects of rising inflation, relative to other asset classes or business entities in the economy.
A look at the investment landscape
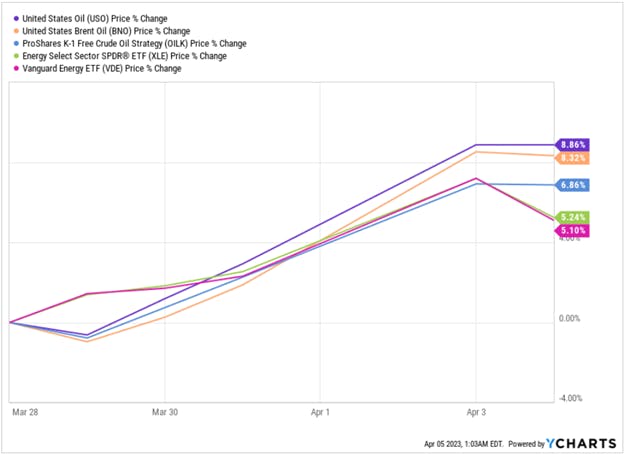
The OPEC announcement saw energy ETFs rally, highlighting the opportunity that exists for investors desiring to gain some exposure to the energy sector within their portfolio.
The following chart details Crude Oil ETFs that track the price changes of crude oil, allowing investors to gain exposure to this market. A brief summary of each ETF (or broader ETP) and how they can be of benefit to investors within their portfolio is then outlined below.
United States Oil (NYSE:USO) (USO) delivers its exposure to oil using near-term futures. USO gets exposure to oil using derivatives, like several oil ETPs. The fund predominately holds near-month-futures contracts on West Texas Intermediate (WTI), rolling into future contracts every month. This method is particularly sensitive to short-term changes in spot prices.
United States Brent Oil (BNO) provides exposure to Brent crude oil, as an alternative to a West Texas Intermediate (WTI) benchmark. BNO exclusively trades front-month futures contracts traded on the ICE (NYSE:ICE) Futures Exchange (ICE Futures). The fund’s exposure is focused on short-term futures thus it is extremely sensitive to changes in the spot market, as you'd expect, and it can look very different from the returns you'd see in the WTI market.
Proshares K-1 Free Crude Oil Strategy (OILK) holds West Texas Intermediate (WTI) oil futures in an open-ended ETF wrapper. The underlying index provides equal exposure to three separate WTI Oil futures at each semi-annual reset in March and September. The portfolio exposure is divided into thirds. The first portion follows a monthly roll schedule while the second and third portion holds June and December contracts that are rolled each March and September annually, respectively.
Energy Select Sector SPDR® ETF (XLE) provides pure-play exposure to US energy firms. The fund will have concentrated exposure to the giants in the industry, including companies in the oil, gas and consumable fuels, and energy equipment and services industries. Fund holdings are weighted by market cap, subject to a capping methodology that ensures no single security exceeds 25% at each quarterly rebalance.
Vanguard Energy ETF (NYSE:XLE) (VDE) offers broad exposure to US equity stocks in the energy sector. The fund holds energy companies, stretching across multiple sub-industries from the broadly defined energy space. The fund diversifies its holdings by applying limits on regulated investment companies using the MSCI 25/50 methodology, such that no group entity exceeds 25% of the index weight and the aggregate weight of issuers with over 5% weight in the index is capped at 50% of the portfolio.
As the global energy landscape changes in the coming months due to OPEC’s announcement, investors who want to gain exposure to energy assets could consider the above ETPs for inclusion in their portfolio. However, while commodities have strong diversification capabilities, it is fair to note that they can be volatile, and their performance is highly driven by market dynamics – but if used correctly, they can be truly beneficial in enhancing overall portfolio return.
This content was originally published by our partners at ETF Central.
