- New Chinese threats of trade tariff retaliation throws European shares back into deep red territory, U.S. futures into bumpy ride
- New Chinese threats of trade tariff retaliation throws European shares back into deep red territory, U.S. futures into bumpy ride
- Yields plunge eases but persistent risk off spurs multiple curve inversions
- Yields plunge eases but persistent risk off spurs multiple curve inversions
Key Events
Reports that China will retaliate against the U.S.'s imposition of a 10% tariffs on $300bn of Chinese goods dealt a fresh blow to the market this morning, further stoking investor fears of dismal global growth.
In the early global session, U.S. Treasury yields had temporarily eased, allowing European shares and futures on the S&P 500, Dow and NASDAQ 100 to momentarily pare some losses and Chinese equities to rebound from deep negative territory.
Before taking a new dive into the red, the STOXX 600 crawled higher with travel and leisure stocks, while energy shares offset some of the gains. The FTSE 100, conversely, opened directly into negative territory after U.K. government bonds followed U.S. Treasurys into a yield curve inversion. German and French bond yields also hit record lows after data showing a sharp slowdown in German GDP growth added to pre-existing recession worries.
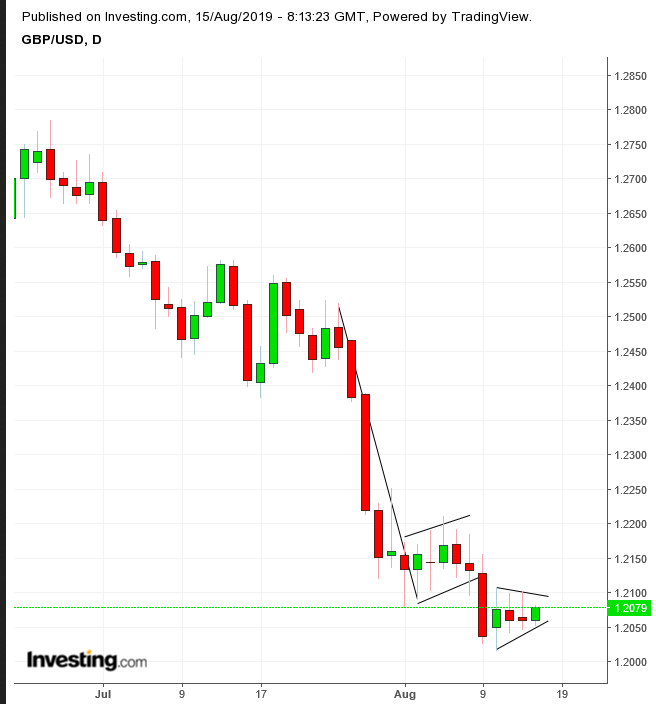
The euro and the pound both gained ground, although they faced technical resistance. After reaching the lowest level since January 2017 and hovering a mere one-quarter percentage point from 1985 lows, cable is forming back-to-back continuation patterns.
During the Asian session, most stocks extended Wednesday's global selloff, while China’s Shanghai Composite closed 0.25% higher after opening 1.64% in the red. The miraculous rebound returned the benchmark into a bearish flag after it posted a downside breakout on the negative open.
Meanwhile, the Chinese yuan remained above the critical 7.00 level for the ninth session.
Global Financial Affairs
Key Events
Reports that China will retaliate against the U.S.'s imposition of a 10% tariffs on $300bn of Chinese goods dealt a fresh blow to the market this morning, further stoking investor fears of dismal global growth.
In the early global session, U.S. Treasury yields had temporarily eased, allowing European shares and futures on the S&P 500, Dow and NASDAQ 100 to momentarily pare some losses and Chinese equities to rebound from deep negative territory.
Before taking a new dive into the red, the STOXX 600 crawled higher with travel and leisure stocks, while energy shares offset some of the gains. The FTSE 100, conversely, opened directly into negative territory after U.K. government bonds followed U.S. Treasurys into a yield curve inversion. German and French bond yields also hit record lows after data showing a sharp slowdown in German GDP growth added to pre-existing recession worries.
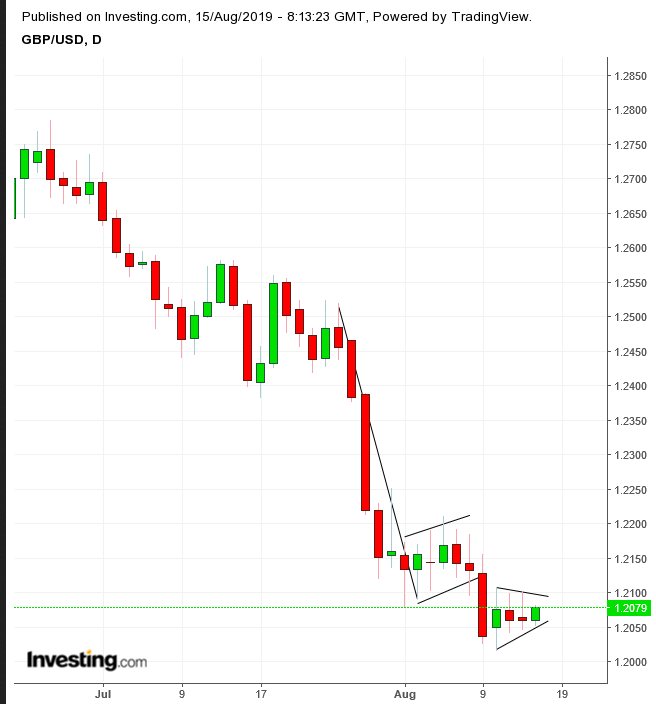
The euro and the pound both gained ground, although they faced technical resistance. After reaching the lowest level since January 2017 and hovering a mere one-quarter percentage point from 1985 lows, cable is forming back-to-back continuation patterns.
During the Asian session, most stocks extended Wednesday's global selloff, while China’s Shanghai Composite closed 0.25% higher after opening 1.64% in the red. The miraculous rebound returned the benchmark into a bearish flag after it posted a downside breakout on the negative open.
Meanwhile, the Chinese yuan remained above the critical 7.00 level for the ninth session.
Global Financial Affairs
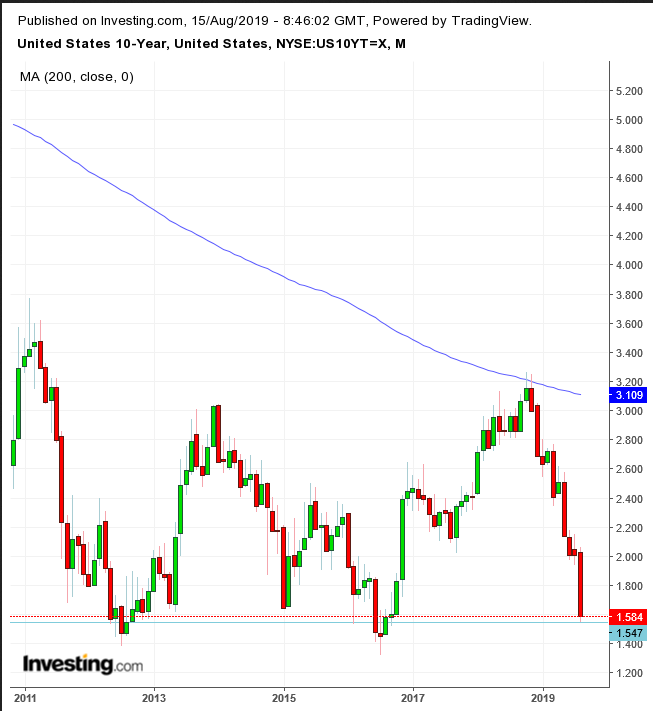
Even after today's rebound, a continued rush into Treasurys pushed yields further down, to the lowest level since September, leaving them little changed from yesterday’s close. The recent dovish shift by the Fed had already pulled the 3-month yield above the 10-year yield, while increasing global geopolitical risk temporarily pushed the 10-year yield below the 2-year yield for the first time since 2008. Finally, the 30-year yield fell below 2%—hitting its lowest level on record.
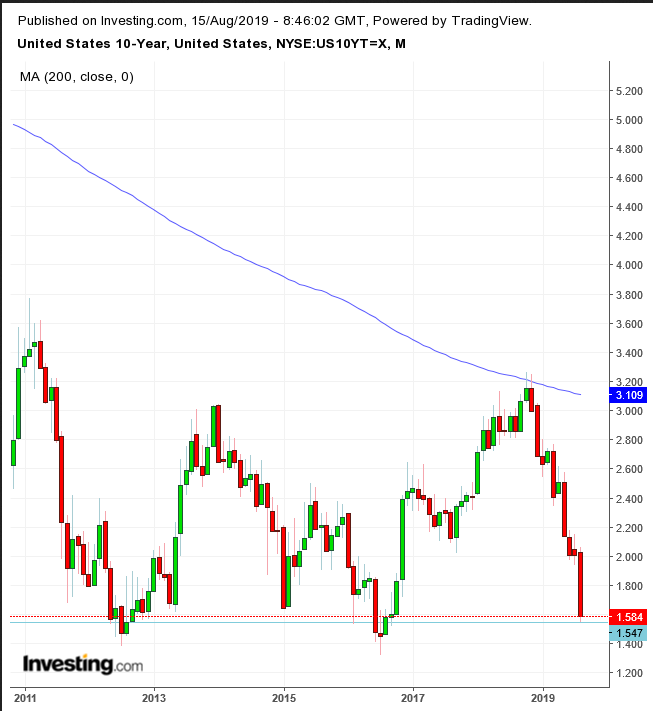
Even after today's rebound, a continued rush into Treasurys pushed yields further down, to the lowest level since September, leaving them little changed from yesterday’s close. The recent dovish shift by the Fed had already pulled the 3-month yield above the 10-year yield, while increasing global geopolitical risk temporarily pushed the 10-year yield below the 2-year yield for the first time since 2008. Finally, the 30-year yield fell below 2%—hitting its lowest level on record.
From a technical standpoint, 10-year yields completed a rising flag, bearish after the plunge from 2.1%, and are therefore expected to resume the slide toward 1.4%, above the 2012 and 2016 lows.
From a technical standpoint, 10-year yields completed a rising flag, bearish after the plunge from 2.1%, and are therefore expected to resume the slide toward 1.4%, above the 2012 and 2016 lows.
Market participants are now debating whether a multiple yield curve inversion would necessarily signal an imminent recession in the current market dynamic. One element is certain: volatility will be on the rise, as bears and bulls continue to fight to take advantage of what they consider a pivotal market point. We will continue to monitor supply and demand dynamics. Meanwhile, a batch of key economic data coming out in the U.S. session, including U.S. factory output and retail sales, will shed more light on how substantiated are investor worries.
Market participants are now debating whether a multiple yield curve inversion would necessarily signal an imminent recession in the current market dynamic. One element is certain: volatility will be on the rise, as bears and bulls continue to fight to take advantage of what they consider a pivotal market point. We will continue to monitor supply and demand dynamics. Meanwhile, a batch of key economic data coming out in the U.S. session, including U.S. factory output and retail sales, will shed more light on how substantiated are investor worries.
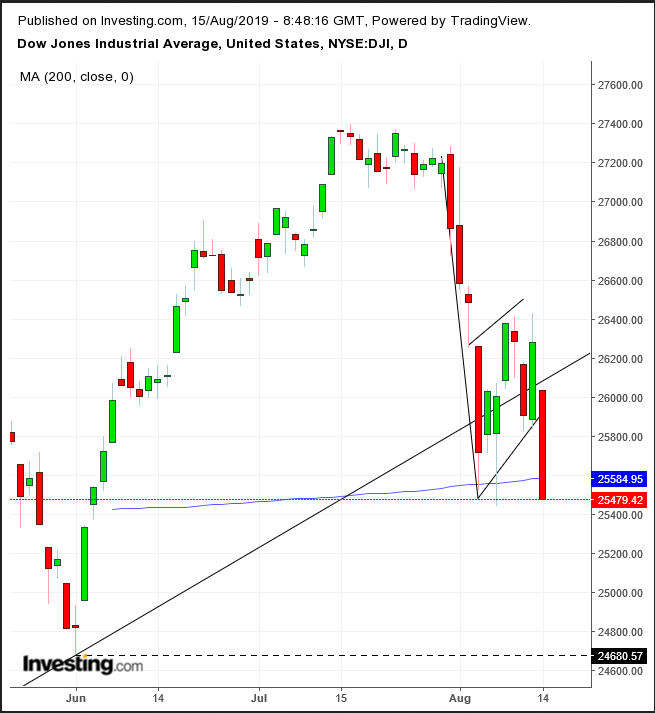
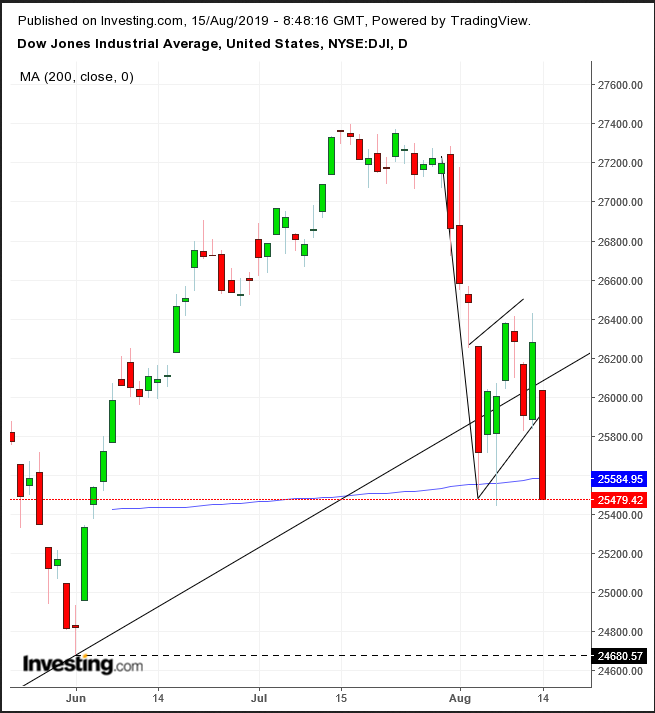
Yesterday, amid a broad Wall Street selloff, the Dow sank 3.05%, completing a rising flag, bearish following its earlier price plunge. At the same time, the index closed at the bottom of the session below the 200 DMA, after having already slipped below the uptrend line since the December bottom. The next test is the 24,680 June low.
Yesterday, amid a broad Wall Street selloff, the Dow sank 3.05%, completing a rising flag, bearish following its earlier price plunge. At the same time, the index closed at the bottom of the session below the 200 DMA, after having already slipped below the uptrend line since the December bottom. The next test is the 24,680 June low.
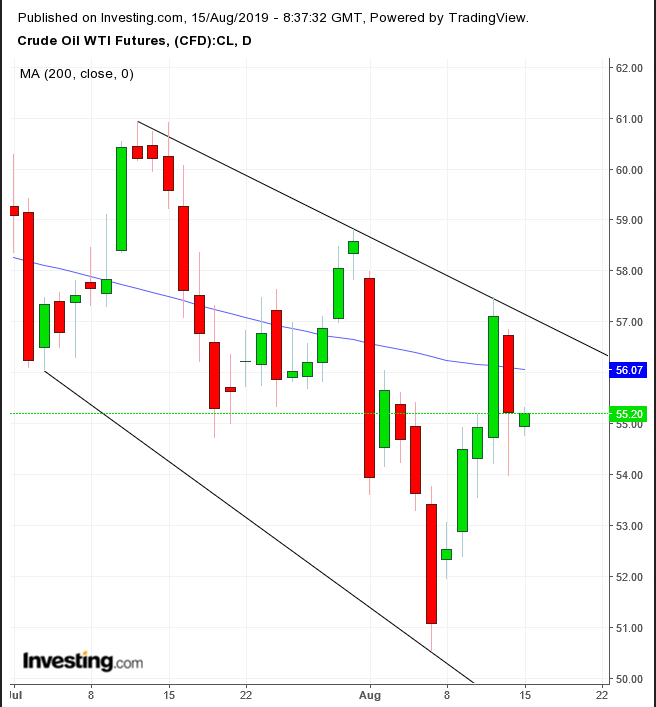
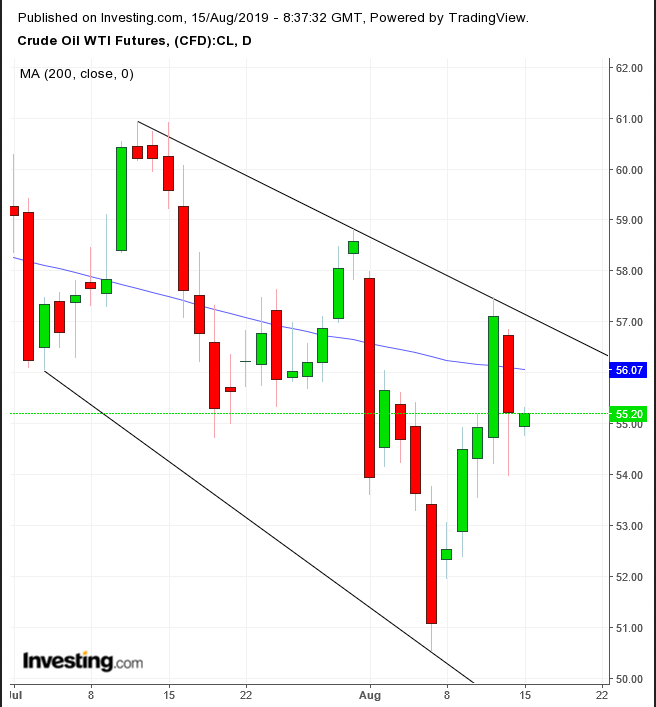
WTI rebounded from a lower open but was little changed since yesterday’s selloff, which was sparked by both a surprise U.S. crude inventory build and continued demand concerns, after the bond yield curve inversion exacerbated trade war-related growth fears. Technically, the price found resistance by the top of a falling channel and the 200 DMA.
WTI rebounded from a lower open but was little changed since yesterday’s selloff, which was sparked by both a surprise U.S. crude inventory build and continued demand concerns, after the bond yield curve inversion exacerbated trade war-related growth fears. Technically, the price found resistance by the top of a falling channel and the 200 DMA.
Market Moves
Market Moves
Stocks
Stocks
- The U.K.’s FTSE 100 Index slid 0.1%.
- The U.K.’s FTSE 100 Index slid 0.1%.
- The MSCI Asia Pacific Index dropped 0.9%.
- The MSCI Asia Pacific Index dropped 0.9%.
Currencies
Currencies
- The Dollar Index declined 0.5%.
- The Dollar Index declined 0.5%.
- The euro was little changed at $1.1142.
- The euro was little changed at $1.1142.
- The British pound rose 0.1% to $1.2072.
- The British pound rose 0.1% to $1.2072.
- The Japanese yen weakened 0.3% to 106.22 per dollar.
- The Japanese yen weakened 0.3% to 106.22 per dollar.
Bonds
Bonds
- The yield on 10-year Treasurys gained one basis point to 1.58%.
- The yield on 10-year Treasurys gained one basis point to 1.58%.
- The yield on two-year Treasurys fell less than one basis point to 1.58%.
- The yield on two-year Treasurys fell less than one basis point to 1.58%.
- Germany’s 10-year yield declined less than one basis point to -0.65%.
- Germany’s 10-year yield declined less than one basis point to -0.65%.
- Britain’s 10-year yield rose less than one basis point to 0.448%.
- Britain’s 10-year yield rose less than one basis point to 0.448%.
Commodities
Commodities
