- U.S. futures, European shares mixed on wavering expectations for U.S.-China trade truce
- Yields, dollar slide in correction mode
- Bitcoin snaps 50% rally
- Gold drops
Key Events
European shares and futures on the S&P 500, Dow and NASDAQ 100 turned a positive opening into mixed fortunes this morning, as investors struggled to hold onto hopes that U.S. President Donald Trump and Chinese leader Xi Jinping will declare a trade cease-fire this weekend.
Dow contacts and stocks on the STOXX 600 in particular reversed their course, signalling persistent caution ahead of the paramount U.S.-China talks—though futures on the U.S. large-cap index were also weighed down by fresh regulatory headwinds for aviation giant Boeing (NYSE:BA).
Earlier, the pan-European benchmark had managed to briefly halt a four-day losing streak, helped by gains in retailers stocks that were boosted by H&M (ST:HMb) reporting higher sales for June. However, the Swedish clothing chain also unveiled a drop in profits, which forced the group to scrap expansion plans. The fact that investors initially focused on the good news while disregarding weaker data is testament to how much they're counting on a U.S.-China tariff truce to prop up the equity market. They also seemed to trust that Fed Chair Jerome Powell’s latest statements—which signaled the central bank will respond appropriately to any further trade risk—will in practice translate into lower interest rates.

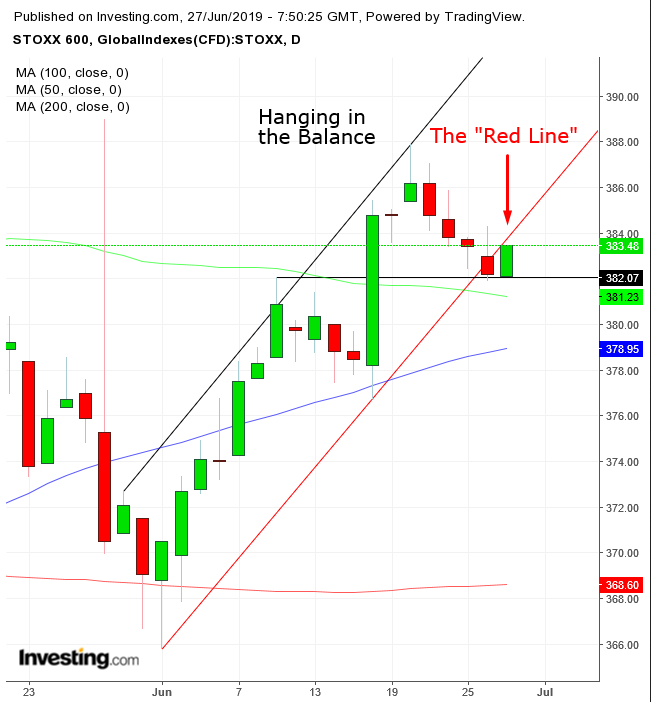
The index found support above the early-June highs, confirmed by Tuesday’s hammer, above the 50 DMA. Having said that, the onus is on the benchmark to demonstrate it can return into the ascending channel, after slipping below it on Wednesday.
In the earlier session, Asian equities climbed after the South China Morning Post reported the two economic superpowers had reached a tentative agreement ahead of the high-stakes meeting on the sidelines of the G20 summit in Osaka this weekend—after a plethora of mixed messages by Trump and his administration.
Revived optimism drove the MSCI’s broadest index of Asia-Pacific excluding Japan 0.8% higher.
Hong Kong’s Hang Seng outperformed, leaping 1.49% and closing at the top of the session, after bouncing off the 50 DMA and cutting through the 100 DMA to the highest price since May 8.
Japan’s Nikkei 225 was the second best performer, notching a 1.19% gain. Prices are also benefiting from the fact that domestic stocks have become increasingly palatable for young citizens who fear the country’s pension system will not allow them to maintain their living standards.
Global Financial Affairs
On Wednesday, the S&P 500 slid for a fourth day (-0.12%), with 60% of its listed stocks losing ground after Trump reiterated broader tariffs on Chinese goods are not off the table yet and threatened to cut business ties with his trade opponent.

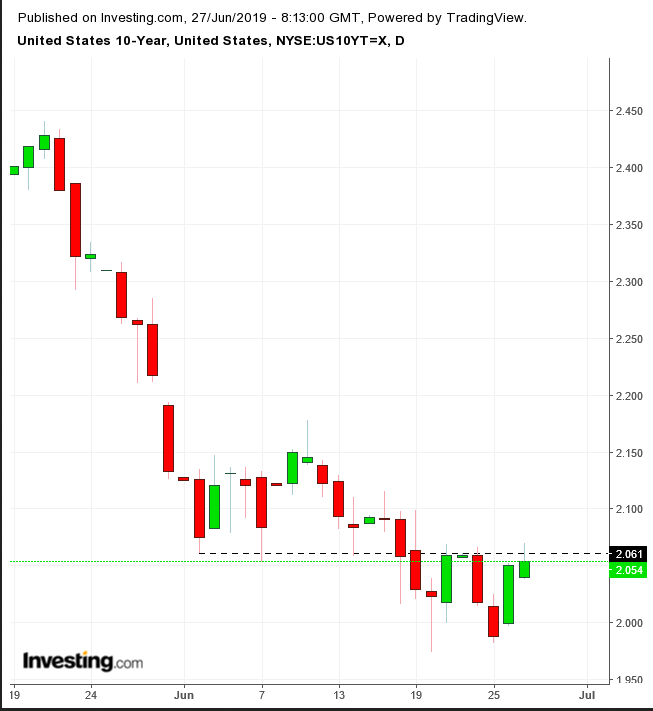
Meanwhile, yields on 10-year Treasurys inched lower after climbing for a second day as investors back pedaled into stocks. They hit a brick wall when reaching the lows of the first half of the month, which have turned from support to resistance after being breached last week.

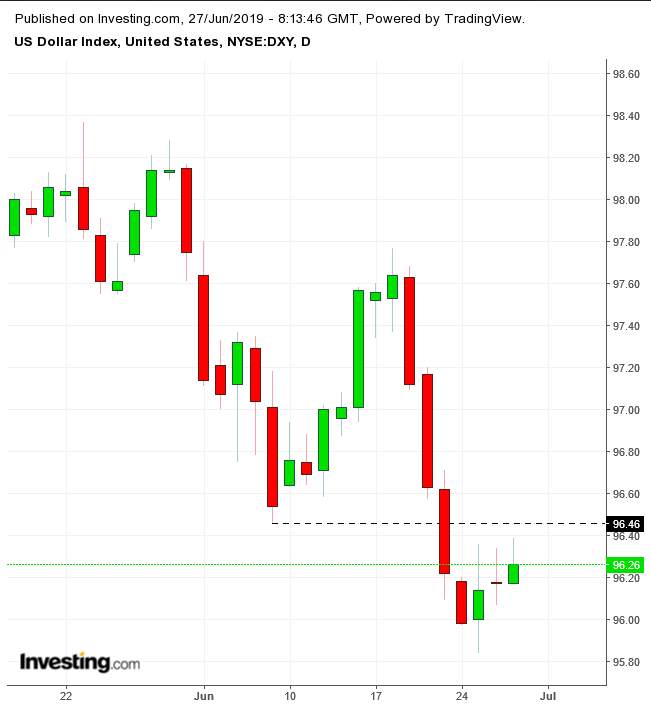
The Dollar Index pared its third-day gains due to a similar dynamic: it hit the support-turned-resistance of the previous trough.
Bitcoin dropped for the first time in nine sessions, after a more than 50% rally.
Gold is falling for the third straight day after a five-straight-day climb, adding about 7%, pulling the 50 DMA over the 100 DMA.

Oil dropped after climbing 10.5% over four out of five days. Traders are waiting impatiently for the outcome of the Trump-Xi talks, the trade dispute representing the main culprit of the falling global demand outlook. China is expected to devalue the yuan to compensate for higher tariffs and falling exports. In turn, the devalued yuan will make oil, which is denominated in dollar, more costly to the Asian nation, hitting demand.
Further uncertainty comes from the looming OPEC and OPEC+ meetings, as oil producers will gauge supply cuts against growing incentives, especially for Russian companies, to keep prices below $60 in order to hold on to their marketshare.
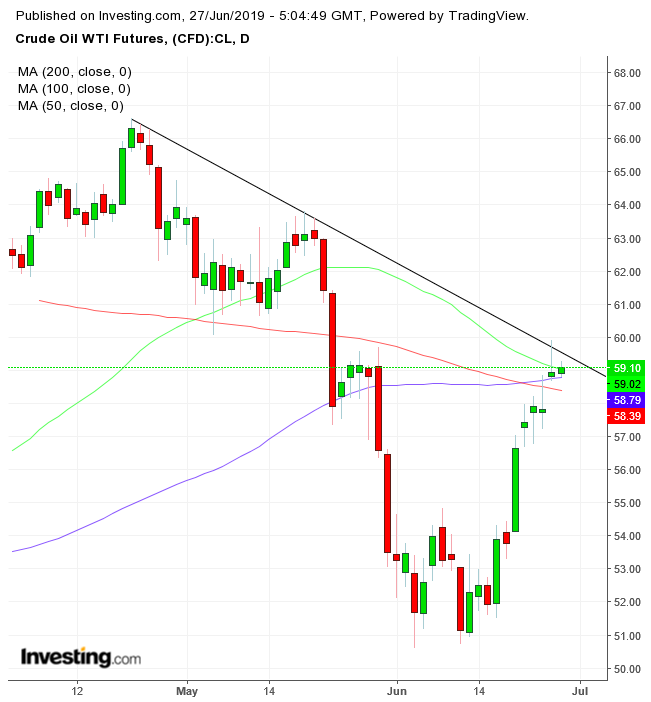
Technically, the WTI price is being squeezed between its downtrend line since the April 23 peak and the confluence of the major MAs.
Up Ahead
- The third estimate of first-quarter U.S. GDP as well as weekly jobless claims data come out at 8.30am ET today.
- Also on Thursday, FOMC member Patrick Harker speaks at 10:00am ET.
- The Group of 20 two-day summit kicks off is in Osaka, Japan, on Friday.
Market Moves
Stocks
- The U.K.’s FTSE 100 increased 0.1%.
- The MSCI Emerging Market Index climbed 0.8% to the highest in seven weeks.
- The MSCI Asia Pacific Index jumped 0.9%.
Currencies
- The Dollar Index gained about 0.05%.
- The euro slid less than 0.05% to $1.1367.
- The British pound advanced 0.1% to $1.2703.
- The Japanese yen dropped 0.2% to 108.04 per dollar, the weakest in a week.
Bonds
- The yield on 10-year Treasurys edged two basis points higher to 2.06%, the highest in more than a week.
- Germany’s 10-year yield gained two basis points to -0.28%, the highest in more than a week.
- Britain’s 10-year yield advanced three basis points to 0.858%, the highest in a week.
Commodities
- West Texas Intermediate crude slid 0.6% to $59.00 a barrel, the largest fall in more than a week.
- Gold fell 0.4% to $1,403.58 an ounce.
