- Investors afraid of deflation dump U.S. futures, global stocks
- Saudi Arabia fires first salvo in oil price war with Russia, U.S. shale
- Entire Treasury yield curve sinks below 1.00% for first time in history
Key Events
U.S. futures for the S&P 500, Dow Jones and NASDAQ all plunged nearly 5% this morning, as markets started the trading week. Crude oil prices collapsed, gapping down more than 31%, in early Monday trade, the worst rout for the commodity since the 1991 Gulf War. As well, the Treasury yield curve ripped out the floor.
Gold went wild, penetrating the $1,700 level, before falling back down. The yen reached its highest level since 2016.
Global Financial Affairs
It felt like all hell was breaking loose when world markets opened earlier today, triggered by a stronger level of accelerating coronavirus fears.
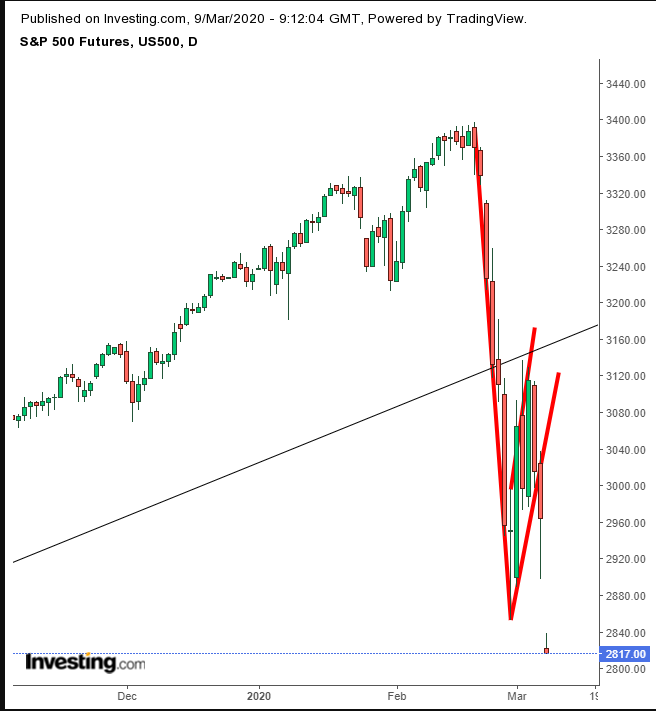
U.S. futures trading was halted earlier today, after contracts plunged 5%, hitting their daily down limit. S&P 500 futures extended a downside breakout to a rising flag, bearish after the near -16% neck breaking plunge in the seven sessions between Feb. 20-28. The implied target of the flag pole is around the 2,500 levels.
Following the collapse of the OPEC+ production cut agreement on Friday, after Russia abandoned the deal in order to weather a plunge in demand amid the virus panic, Saudi Arabia upped the ante by slashing its official oil pricing while making plans to ramp up production.
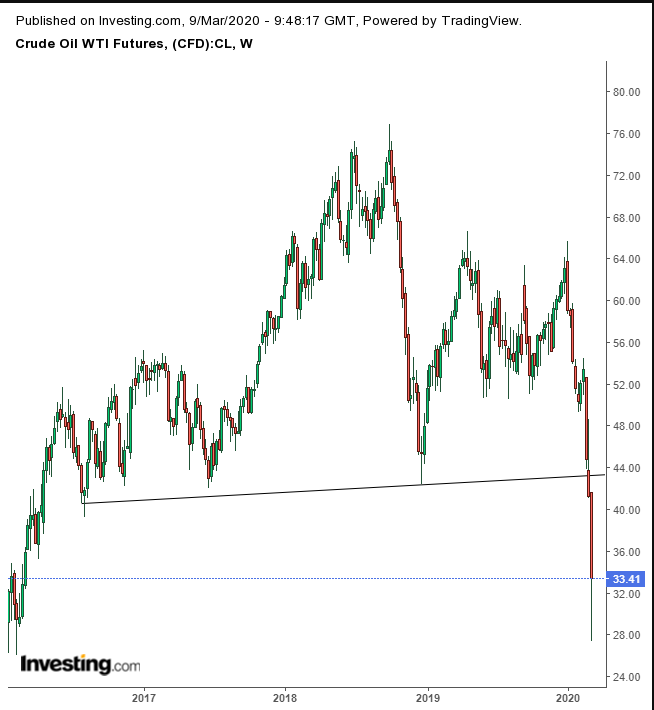
Oil completed a massive H&S top since 2016. The price fell as low as $27.34 but has come back with a vengeance, now trading at $33.16.
The trading pattern formed an exceptionally powerful hammer, with a tiny real body and an extremely long, lower shadow. The psychology and market mechanics in play presumably caused a short-cover panic, creating sudden demand. If the price closes with these conditions still in effect, it may continue climbing, to retest the $40 level, which has been a support since August 2016. Before this climb, however, the price might retest today’s lows.
Europe Entering Bear Market
The STOXX Europe 600 fell 5.75%, to their lowest point since January 2019. The pan-European benchmark is down 20.10% since its Feb. 19 closing peak of $433.90. if the index locks in this loss (or higher) at the close, the European stock market will have officially entered a bear market.
Asian indices were likewise painted red across the region: Australia’s ASX 200 took the biggest hit, (-7.33%). China’s Shanghai Composite once again outperformed, (-3.01%), despite the country being the source of the global epidemic, and having the overwhelming majority of virus afflicted sufferers and fatalities. Hong Kong’s Hang Seng was once again right behind mainland markets, (-4.23%).
The entire Treasury yield curve plunged below 1.0%.
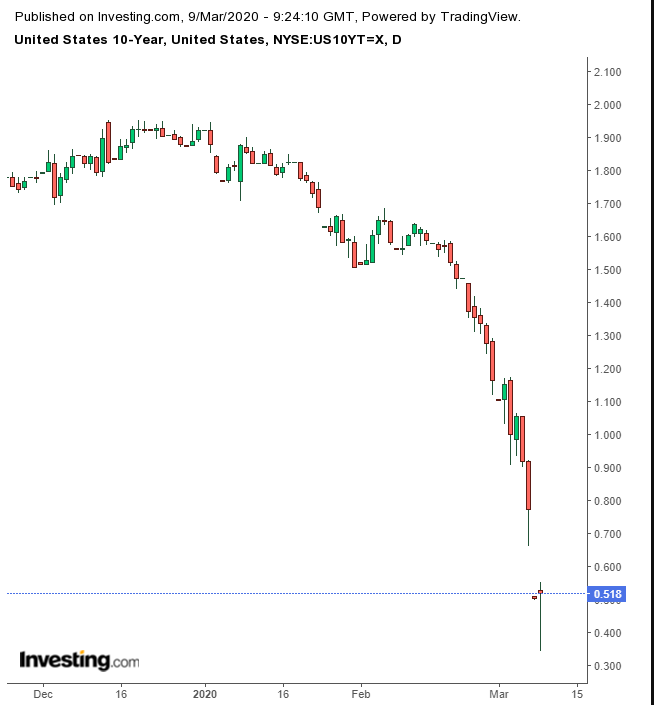
Yields on the 30-year long bond fell below 1.0% for the first time on record; 10-year yields reached as low as 0.342%, before they rebounded to 0.518%, forming an imperfect (upper shadow), but powerful (extremely long lower shadow) hammer.
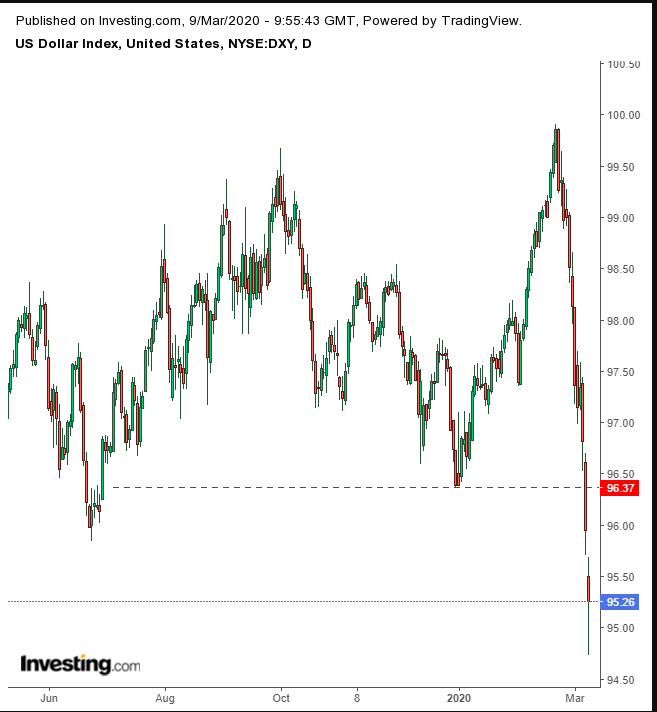
At one point on Monday, the U.S. dollar dropped to its lowest since September 2018, but trimmed losses to the lowest since January 2019. The decline extended a double top, whose implied mark targets 93.00.
Gold leaped past the $1,700 mark earlier today, to its highest position since 2012. However, the oil plunge sparked deflationary fears, rendering the dollar-denominated yellow metal overvalued, sending it into a decline.
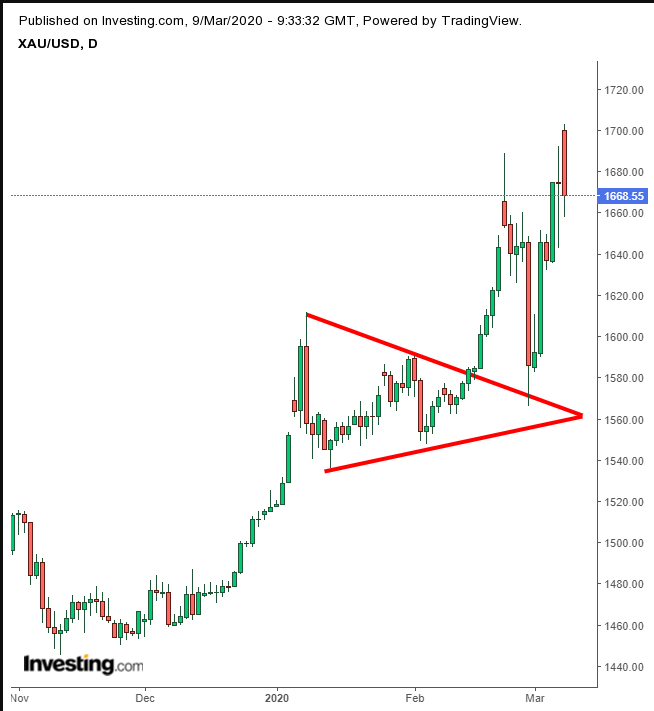
On Friday, the high wave candle confirmed the shooting star of Feb. 24, which could prompt a second pullback to confirm the bullish pennant that preceded the jump from $1,600.
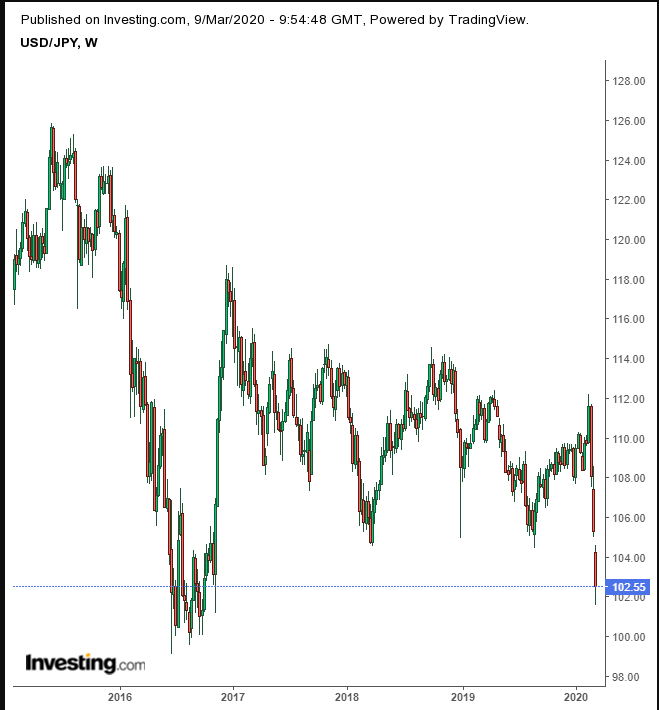
Investor flight to safe havens caused the Japanese yen to strengthen the most since Sept. 29, 2016. Unlike gold, whose value is reduced by deflation, the JPY thrives under these conditions.
Cryptocurrencies weren't immune to the market turmoil this morning.
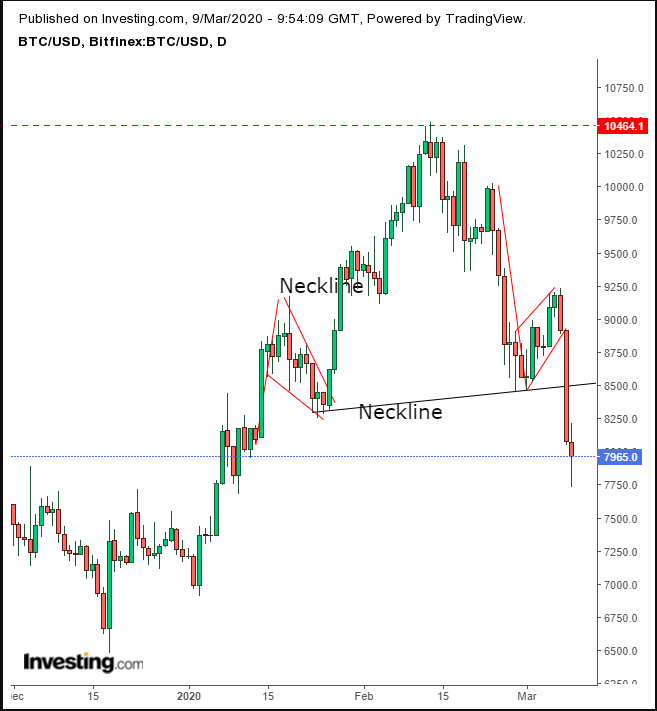
Bitcoin plunged, perhaps for the same reason gold did. Technically, the digital currency followed through on our analysis from last week, regarding the recent rising flag. It completed a H&S top as well, whose implied target eyes $6,600.
Up Ahead
- The U.S. core consumer price index, due Wednesday, is expected to have remained flat in February.
- The U.K.'s Chancellor of the Exchequer unveils the government’s 2020 budget on Wednesday.
- The European Central Bank’s next policy decision is announced on Thursday; expectations are it may ease policy.
Market moves
Stocks
- Futures on the S&P 500 Index dropped 4.9%.
- The Stoxx Europe 600 Index sank 6.4%.
- The MSCI Asia Pacific Index slumped 4.2%.
- The MSCI All-Country World Equity Index dipped 1.9%.
Currencies
- The Dollar Index dropped 0.7% to 95.30.
- The euro surged 1.2% to $1.1423.
- The British pound climbed 0.9% to $1.3168.
- The Japanese yen strengthened 3% to 102.29 per dollar.
- The Mexican peso weakened 6.9% to 21.6052 per dollar.
Bonds
- The yield on 10-year Treasuries tumbled 29 basis points to 0.47%.
- The yield on 2-year Treasuries dipped 18 basis points to 0.32%.
- Germany’s 10-year yield sank 11 basis points to -0.82%.
- Japan’s 10-year yield declined four basis points to -0.163%.
Commodities
- West Texas Intermediate crude fell 23% to $31.92 a barrel.
- Brent crude fell 22% to $35.98 a barrel.
- Gold strengthened 0.2% to $1,676.38 an ounce.
- LME zinc sank 3.4% to $1,916.50 per metric ton.
- Iron ore declined 1.9% to $85.43 per metric ton.
