- U.S. futures extend rally, SPX contracts eye new record close on rate cut bullishness
- HSBC earnings flop pressures European shares
- Asian indices hit three-month high on trade optimism
- Treasury yields jump on expected Fed dovishness
Key Events
Futures on the S&P 500, Dow and NASDAQ 100 extended Friday's advance this morning, taking their cue from the S&P 500's push near a new record close, on speculation the Fed will cut rates on Wednesday—an expectation that also propelled 10-year Treasury yields to a six-week high.
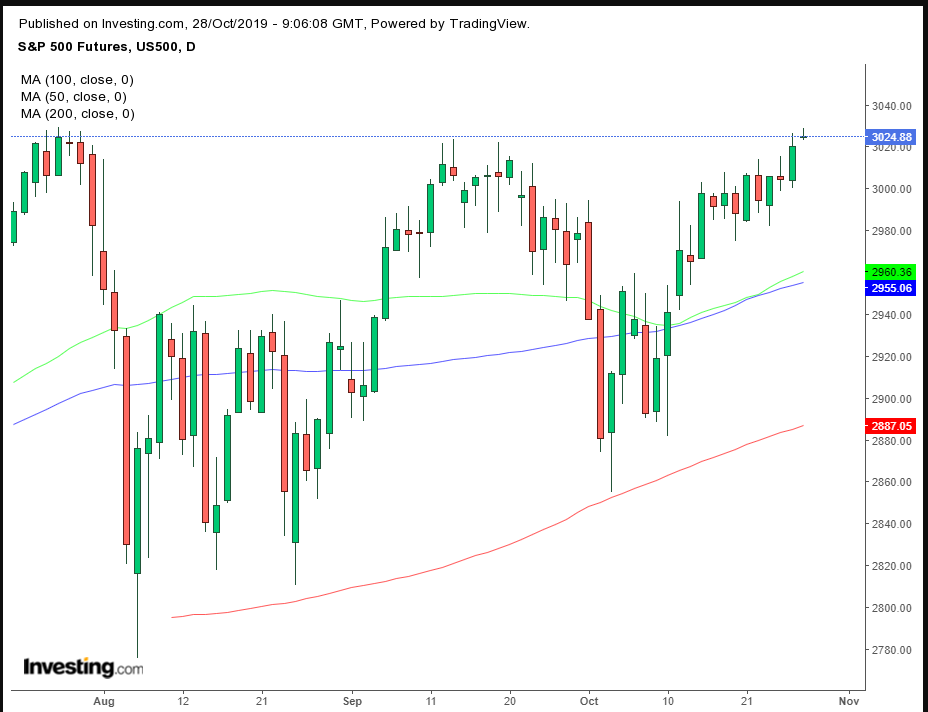
SPX futures in particular, now hovering at 3024.62, are threatening to surpass the 3027.98 record close registered on July 27.
While consensus is growing for a third straight interest rate cut this week, what will truly move markets will be more concrete signals on whether policymakers will wrap up their monetary easing cycle or leave the door open for more.
Analysts think that, despite the equity market's recent record highs, the U.S. central bank is likely to remain dovish as recession appears to be resurfacing in Europe and permeating in the U.S. economy too, with the U.S.-China trade spat and Brexit uncertainties still lurking in the background.
With a market-based probability of 93.5% for a 0.25% rate cut—to a 1.50%-1.75% range, from the current 1.75%-2%—it’d be key that the Fed doesn’t shock markets. Futures have priced in about 23 basis points of reduction: historically, policymakers have never withheld easing against such heavily-stacked expectations.
Meanwhile, European stocks failed to follow Asian shares higher: banks shares led a slide on the STOXX 600 after HSBC (LON:HSBA)—Europe’s largest lender—posted weak earnings, with an 18% pre-tax profits drop from last year and a 24% quarterly profits cut.
In the earlier Asian session, regional equities hit three-month highs on hopes the U.S.-China deal will reach completion as early as next month. Better-than-expected U.S. corporate results compounded trade optimism.
Naturally, China’s Shanghai Composite (+0.85%)—where block chain-related stocks advanced after President Xi Jinping praised the technology—and Hong Kong’s Hang Seng (+0.84%) were the biggest beneficiaries of the positive outlook on trade.
MSCI's broadest index of Asia-Pacific shares outside Japan added 0.5%, for its third straight day of gains to the highest level since late July.
Global Financial Affairs
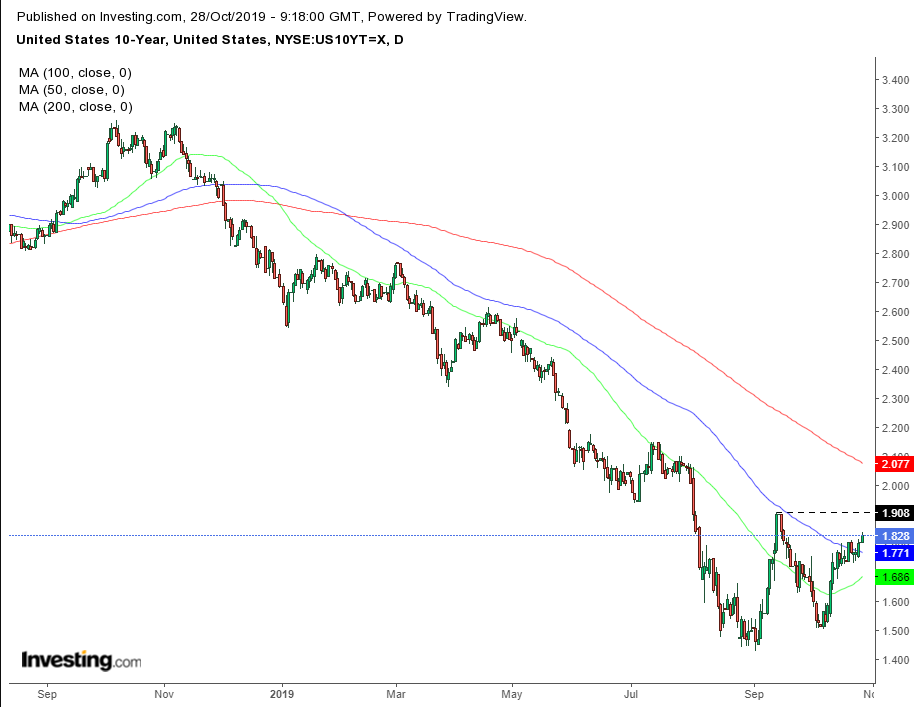
The yield on 10-year Treasurys climbed for the third straight day. Technically, the yield rally crossed above the 100 DMA as it approached the Sept. 13 high, which, if crossed, would establish a short-term uptrend, for the first time since the November 2018 top.
On the safe-heaven front, the yen was flat even despite the fact the dollar dropped for the first time in three days. Gold didn’t jump on USD weakness either, weakening the case for a risk-off market.
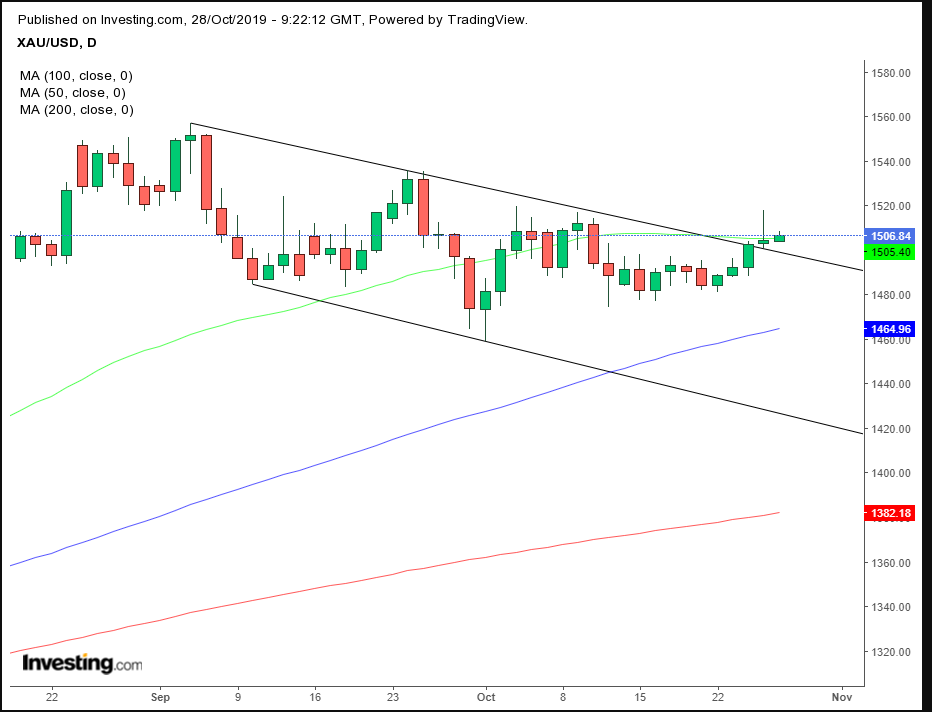
The yellow metal did however edge higher, reaching the highest price since Oct. 9. Also, it extended an upside breakout from a falling channel. However, Friday’s shooting star could prove the end of the rally within the downtrend.
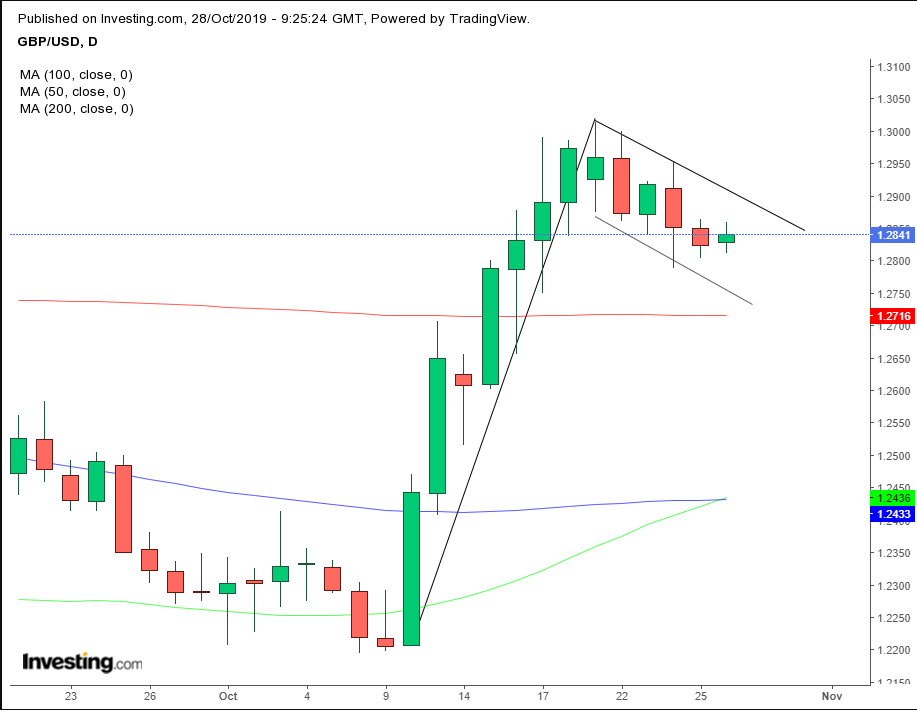
The pound pared a two-day loss after France’s President Emmanuel Macron joined other EU leaders in granting the U.K. a three-month Brexit extension, easing the odds of a no-deal Brexit, which would have seen the U.K. automatically ejected from the bloc on Thursday. Technically, cable may be forming a falling flag, bullish after the 6.6% jump on Oct. 10 to Oct. 21.
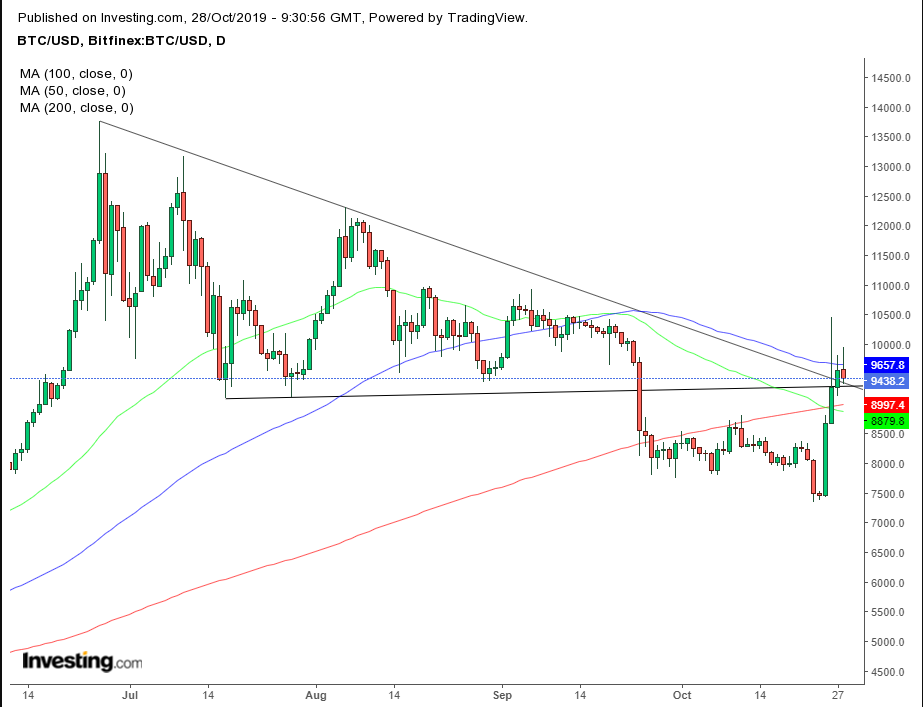
Bitcoin slipped lower for the first time in four days, even after Chinese President Xi Jinping talked up the technology. Technically, the digital token climbed back above the 200 DMA but failed to break through the meeting point of a descending triangle’s top and bottom and the 100 DMA. The next move could prove explosive.
Up Ahead
- Earnings include: Alphabet (NASDAQ:GOOGL), AT&T (NYSE:T), Facebook (NASDAQ:FB), Pfizer (NYSE:PFE), Airbus (PA:AIR), Apple (NASDAQ:AAPL), Exxon Mobil (NYSE:XOM), BP (NYSE:BP), PetroChina (NYSE:PTR), Credit Suisse (SIX:CSGN), Nomura (T:8604) and Macquarie Group (ASX:MQG).
- The Federal Reserve is expected to lower the main interest rate on Wednesday.
- U.S. economic growth slowed to 1.6% in the third quarter, GDP data is expected to show on Wednesday.
- The Bank of Japan sets policy on Thursday, with Governor Haruhiko Kuroda holding a news conference after the monetary decision.
- Monthly U.S. nonfarm payrolls numbers come up on Friday.
Market Moves
Stocks
Currencies
Bonds
Commodities
