- U.S. futures edge lower, giving up Monday's fresh records
- European shares drop as investors make space for Saudi Aramco ahead of Sunday's IPO
- Treasurys jump, signaling expectations the Fed will halt cuts after Wednesday
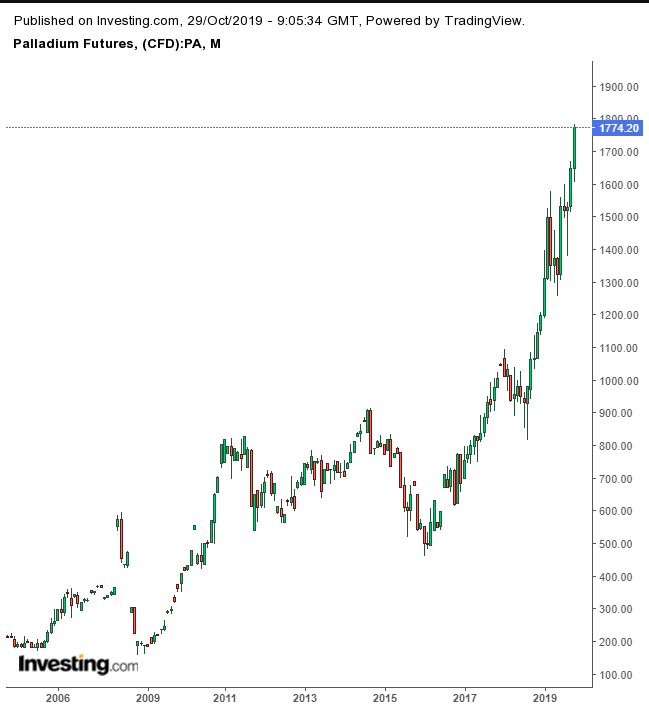
- Palladium hits record high on stricter air-quality laws
Key Events
Futures on the S&P 500 and the Dow dropped alongside European stocks this morning, while tech contracts on the NASDAQ 100 clung onto positive territory for a little longer, capitalizing on the fresh record highs hit by U.S. equities on Monday.
The S&P 500 (+0.56%) and the NASDAQ 100 (+1.01%) posted new all-time highs as risk-on surged on the back of bullish signals for a trade resolution between the world’s two largest economies—with U.S. President Donald Trump expecting to sign a "very big portion" of the future trade deal with China ahead of schedule.
Also helping the rally was a over 90% consensus for another quarter-point rate cut by the Fed, which is increasingly seen as keen on sustaining financial markets.
We see this optimism as surprising, considering Fed Chair Jerome Powell consistently tied central bank stimulus to the U.S.-China trade dispute's fallout—while insisting that the latest round of cuts was nothing more than a mid-cycle adjustment, rather than the start of a more structured accommodative strategy against an economic slowdown.
Now that trade negotiations are reported to be back on track, we’d expect investors to be doubtful about a third, consecutive interest rate cut. However, one important counter-argument is that, historically, the Fed has never disappointed market expectations when they were so strikingly one-sided—pinning a 96.2% probability of a rate cut by mid European morning.
We would still argue that the Fed is unlikely to cut rates any further after Wednesday, if bond traders' moves —signaling a retrenchment in future rate cut expectations—prove right. What will that mean for U.S. stocks, which are hovering at record highs in large part based on the Fed's policy easing, on top of better-than expected corporate results and trade hopes?
Meanwhile, Europe's STOXX 600 slipped lower, with financial services shares underperforming. The pan-European index erased one and a half sessions of gains, after posting six straight days of winnings that brought the benchmark near a two-year high.
The drop is likely to have been also spurred by the announcement, by Saudi Arabia's state oil company—and the world's most profitable—that Saudi Aramco is finally kicking off its long-awaited Initial Public Offering on Sunday, prompting portfolio managers to shed some existing holdings in order to make room for the new stock.
In the earlier Asian session, regional equities were a mixed bag, with China’s Shanghai Composite (-0.87%) and Hong Kong’s Hang Seng (-0.39%) closing in the red after Hong Kong’s leader Carie Lam warned that months of political protests are taking a harsh toll on the city's economy.
Global Financial Affairs

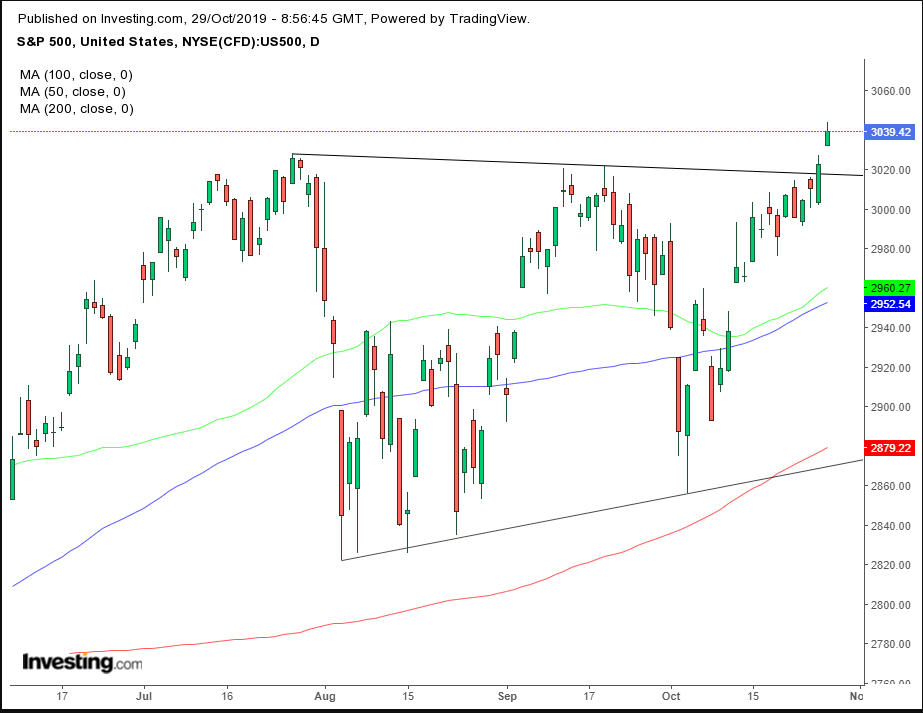
Yesterday, U.S. shares resumed a rally, with the S&P 500 sealing a double record on a closing and a high basis. Technically, the price created a breakaway gap and completed an ascending triangle—both bullish.

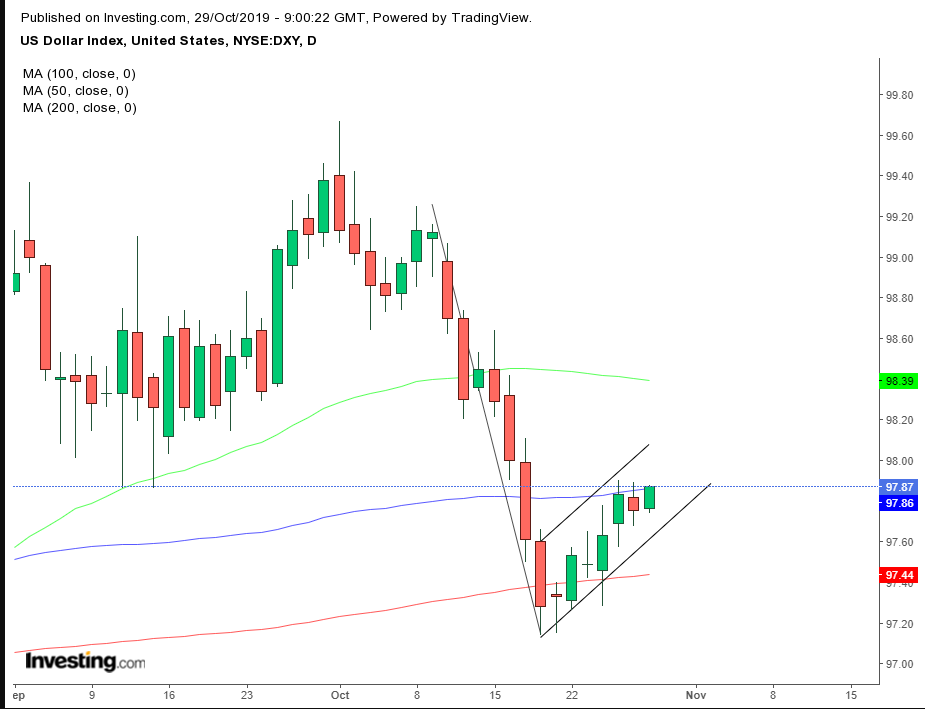
Treasurys jumped with the dollar. Technically, the greenback is struggling against the 100 DMA for the third day, as it may be developing a rising flag, bearish after the preceding drop.

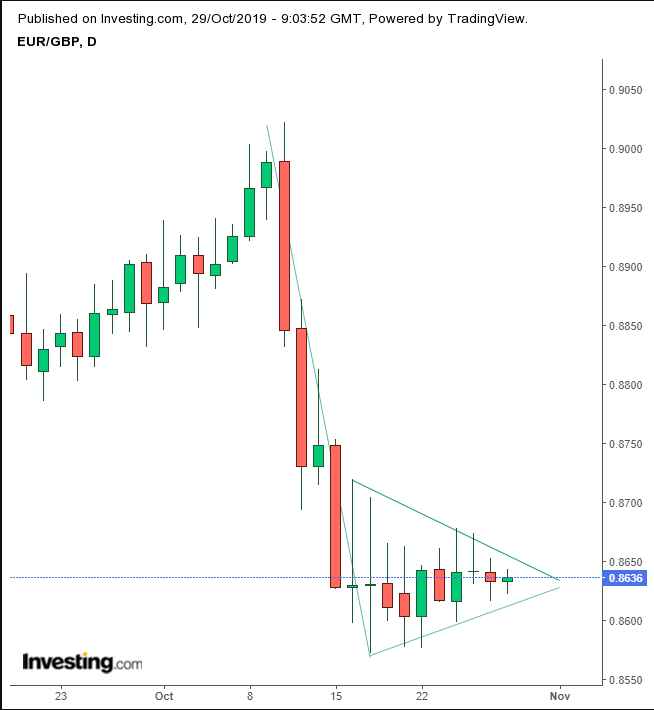
The pound edged lower against the euro as it formed a pennant continuation pattern, bearish after the preceding drop, as U.K. Prime Minister Boris Johnson kept pushing for an early election in December even after formally accepting the EU's offer of a Brexit extension until Jan. 31 2020.

In metals, palladium traded near the record high it achieved yesterday on expectations that stricter air-quality regulations in Europe and China will boost demand for the metal, which used in vehicles' pollution-control devices.
Gold strengthened despite the stronger USD, along with the yen.
Up Ahead
- Earnings include: Facebook (NASDAQ:FB)—where the effect of a profit beat could offset regulatory risk on the stock price—Pfizer (NYSE:PFE), Airbus (PA:AIR), Apple (NASDAQ:AAPL), Exxon Mobil (NYSE:XOM), BP (NYSE:BP), PetroChina (NYSE:PTR), Credit Suisse (SIX:CSGN), Nomura (T:8604) and Macquarie Group (ASX:MQG).
- The Federal Reserve is expected to lower the main interest rate on Wednesday.
- U.S. economic growth slowed to 1.6% in the third quarter, GDP data is expected to show on Wednesday.
- The Bank of Japan sets policy on Thursday, with Governor Haruhiko Kuroda holding a news conference after the monetary decision.
- Monthly U.S. nonfarm payrolls numbers come up on Friday.
Market Moves
Stocks
Currencies
Bonds
Commodities
