- US contracts, European shares begin week with choppy trade
- Asian indices, despite improved regional data, followed Friday’s Wall Street selloff lower
- PBoC vows more liquidity to help China's real economy
Key Events
US futures for the S&P 500, Dow Jones, NASDAQ and Russell 2000, as well as European stocks all reversed on Monday, after opening lower. Each was edging higher at time of writing, buoyed by improved economic data which offset some of the fears triggered by a second wave of COVID-19, even as the total number of confirmed cases globally crossed the 10 million mark.
Yields found their footing and gold pushed higher.
Global Financial Affairs
Chinese data over the weekend demonstrated that while the Asian nation's Industrial Profits were down, -19.3% for the year, they rebounded in May, to 6%, the first increase for this measure since the onset of the pandemic. The PBoC also said it would introduce new tools to ensure liquidity reaches the real economy.
The Stoxx Europe 600 Index started trade this morning in the red, but pushed higher, boosted by travel firms and automobile manufacturers, as investors clung to the notion of a V-shaped recovery, irrespective of rising infections worldwide.
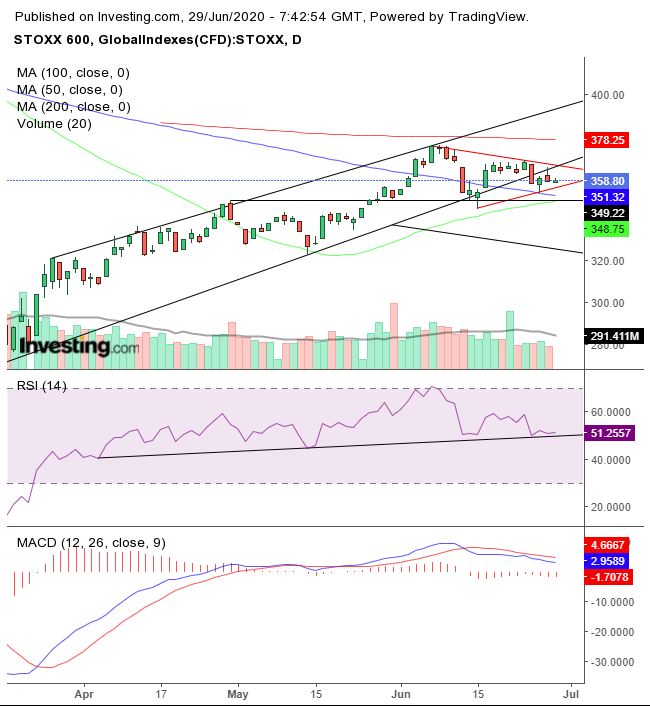
Technically, the pan-European benchmark has entered a pause within its uptrend, after nearing the 200 DMA.
The index is struggling to return into the rising channel while developing a bullish pennant—as opposed to the bearish triangles developed by the Dow and S&P 500—complete with an upside breakout, which should also take it back into the channel. The MACD provided a sell signal from the first time the price fell below the channel but was supported by the 50 DMA. The RSI is keeping above its support since early April, again, as opposed to the two main US indices.
Technicals for the European index suggest the regional markets have been outperforming in recent weeks, thanks to economies restarting and the EU's proposal to create a 750-billion-euro recovery fund.
Even with improved Chinese data, Asian stocks tracked Friday's losses on Wall Street. Japan’s Nikkei underperformed, (-2.3%), pulled lower by Paper and Pulp, Railway and Bus and Real Estate shares. China’s Shanghai Composite outperformed, (-0.6%).
Yields, including for the 10-year Treasury note, may have steadied, but the pressure remains.
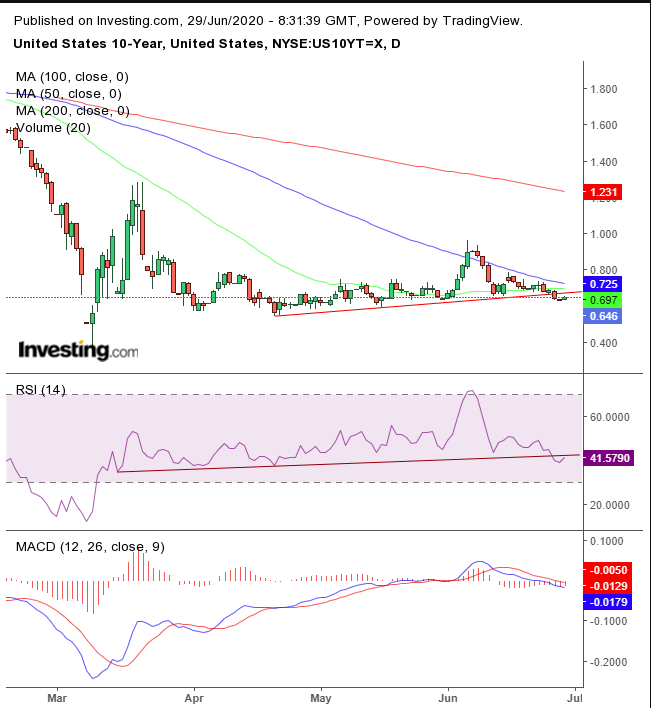
Friday’s equity selloff lifted Treasurys, driving yields below an uptrend since April 21, after finding resistance by the 100 DMA and falling below the 50 DMA. Both the RSI and MACD turned bearish.
It's up to Treasury bears to now propel yields back above the 0.7% mark.
The dollar fell again on Monday.
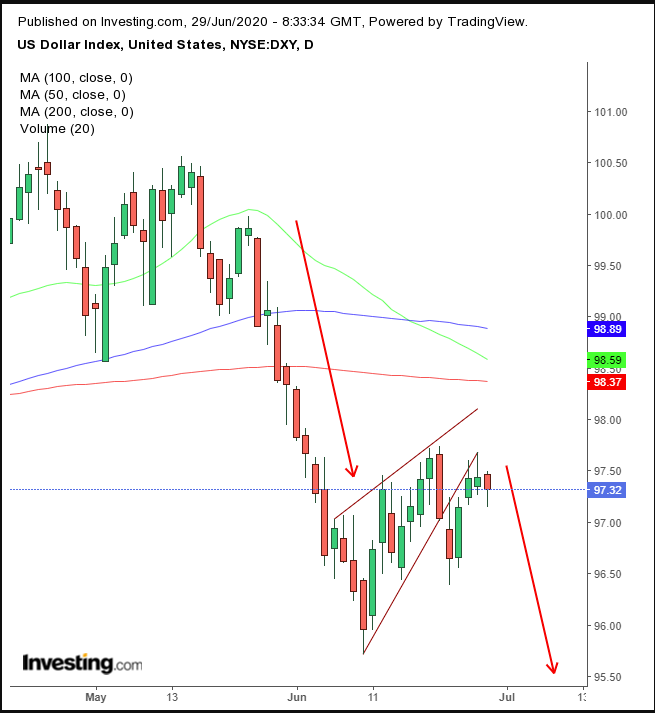
The USD confirmed the resistance from Thursday and Friday resistance, authenticating a bearish flag.
Gold extended Friday’s rally.
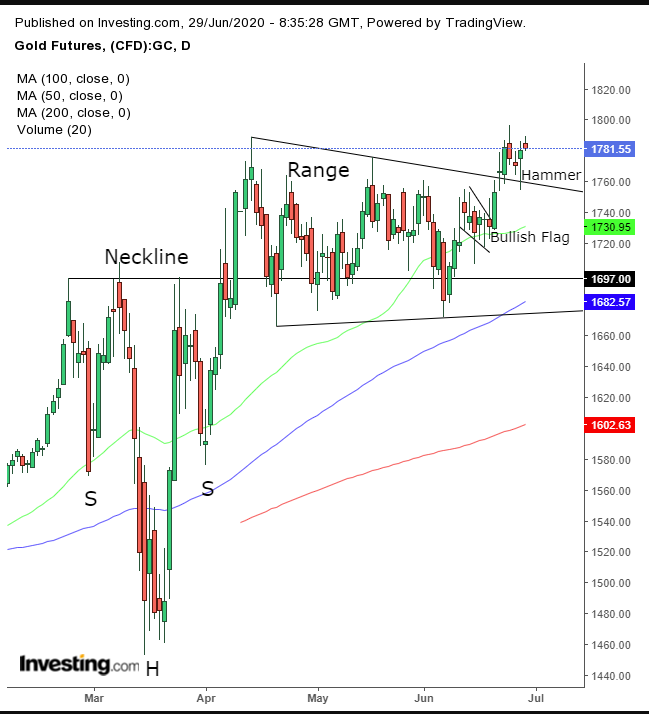
The precious metal's rebound is forming a hammer, which is bouncing off the symmetrical triangle. This suggests an end to the return move following the bullish flag and the range in effect since the completion of a H&S continuation pattern.
Bitcoin continues to edge lower.
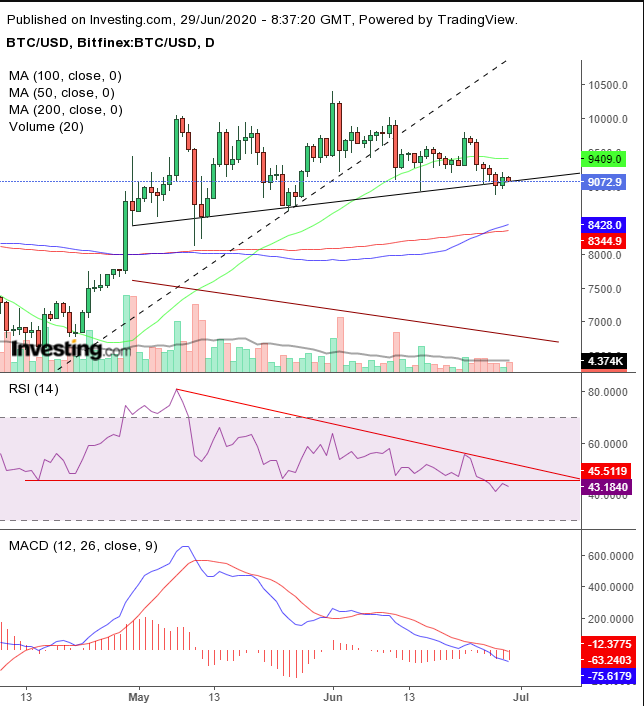
The cryptocurrency is heading toward our interpretive neckline of a potential H&S top. If you believe the RSI and MACD, more downside is all but inevitable.
Earlier today, oil fell below $38. It's currently hanging on just above that round number.
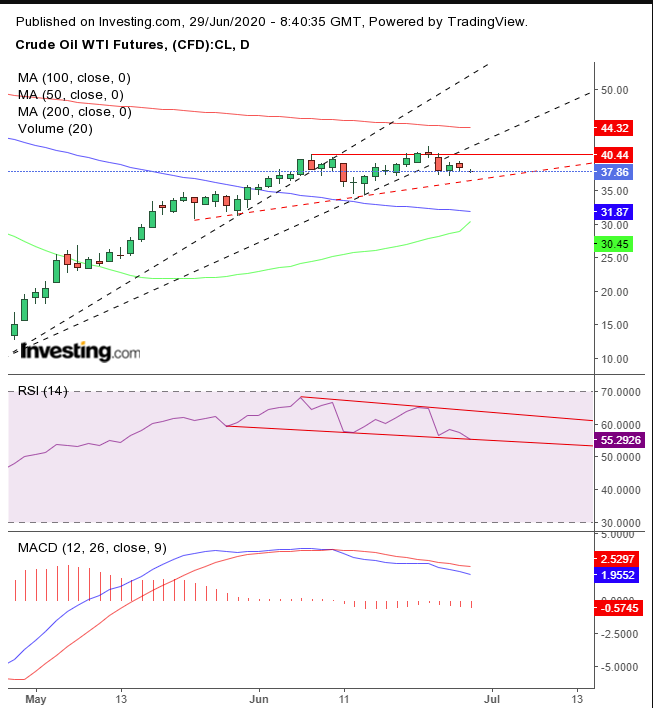
WTI is headed towards the neckline of a potential, up-sloping double-top. Both the MACD and the RSI have provided negative divergences, supporting that scenario.
This may be an appropriate time to recall that the commodity's prices fell $40 below $0, as storage space ran out amid lockdowns. A return to stopping the economy may very well push prices subzero, again.
Up Ahead
- US Pending Home Sales, released later today are expected to have rebounded significantly in May, to 18.9% from -21.9% previously.
- On Tuesday, Federal Reserve Chairman Jerome Powell and U.S. Treasury Secretary Steven Mnuchin testify before the House Financial Services Committee.
- The US nonfarm payrolls report for June, announced one day early because of the July 4th holiday, prints on Thursday. The data-collection issues experienced in May that appear to understate the true scale of joblessness could continue.
Market Moves
Stocks
- The Stoxx Europe 600 Index climbed 0.3%.
- Futures on the S&P 500 Index increased 0.4%.
- NASDAQ futures rose 0.1%.
- The MSCI Emerging Markets Index declined 0.6%.
Currencies
- The Dollar Spot Index decreased 0.1%.
- The euro rose 0.3% to $1.1253.
- The British pound gained 0.3% to $1.2372.
- The Japanese yen was little changed at 107.17 per dollar.
- The offshore yuan strengthened 0.2% to 7.0713 per dollar.
Bonds
- The yield on 10-year Treasuries rose one basis point to 0.65%.
- Germany’s 10-year yield gained two basis points to -0.47%.
- France’s 10-year yield increased one basis point to -0.114%.
- Britain’s 10-year yield climbed one basis point to 0.184%.
Commodities
- Brent crude dipped 1.5% to $40.41 a barrel.
- Gold weakened 0.1% to $1,769.31 an ounce.
- Iron ore dipped 3.9% to $94.16 per metric ton.
