- EU leaders continue to struggle over reaching a deal on budget and coronavirus stimulus package
- US investors rotate out of tech, into beaten-down value shares
- Chinese investors move in the opposite direction
Key Events
US futures for the S&P 500, Dow Jones, NASDAQ and Russell 2000 headed lower on Monday, along with most global indices, fueled by uncertainty over future EU and US economic stimulus. As of this writing, and after three days of negotiating, European Union leaders remain deadlocked on a plan to revive hard-hit local economies devestated by coronavirus slowdowns.
As well, as Congress begins negotiating the next round of stimulus, there remains a broad variance between what the House, the Senate and the US President believe is an appropriate allocation...and to whom.
The euro advanced, the dollar fell and gold gained. Oil slipped for the third day.
Global Financial Affairs
All four contracts on US major indices have fallen by at least half a percent this morning, all struggling to maintain last week’s upward trajectory as investors began rotating out of mega cap tech shares and into value stocks, beaten up during the lockdown.
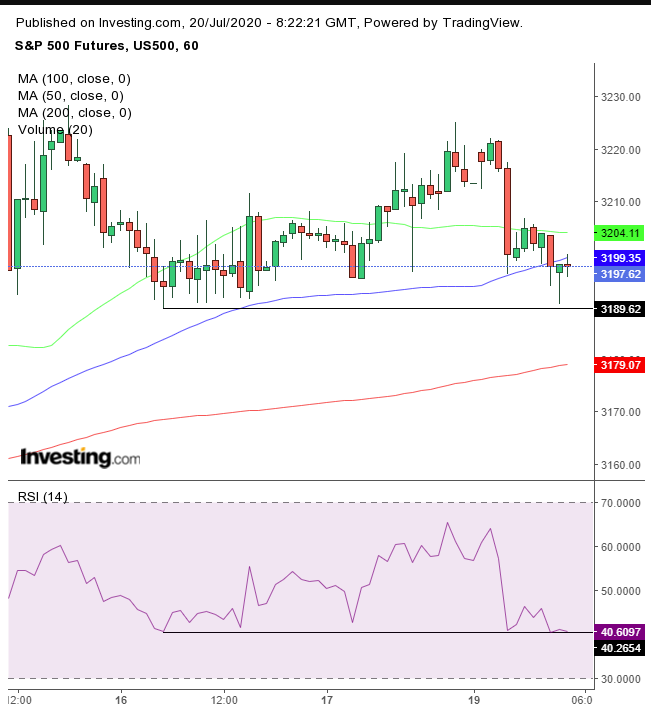
The bulk of declines on S&P 500 futures occurred during the early Asian session. The contract attempted a rebound, only to fall harder at the European open. And, as we write this, traders are giving it yet another go, having established an hourly hammer candlestick, hammering out the support of Wednesday lows. The RSI showed that momentum was in lockstep.
The STOXX Europe 600 dropped right out of the gate over the negotiations stalemate on the EU aid package. As talks dragged on, varying news releases—some positive—indicated that hardline EU leaders were willing to accept major elements of a rescue deal, which had shares trading off their lows and even moving into positive territory.
Most Asian benchmarks closed lower, a result of the European gridlock. Japan’s Nikkei managed to eke a 0.1% gain, even after the country reported trade data that showed exports fell a whopping -26.2% YoY in June.
China’s Shanghai Composite, (+3.1%), remained in the spotlight. The mainland index climbed the most in two weeks, as investors rotated into large caps, moving in the opposite direction of US investors. This morning's price action on the SSEC was the result of a three-day selling spree last week, which left the index 6.8% lower, along with local regulators lifting equity investment caps for insurers.
Last week, US stocks rose for the third week amid volatility and low volume. The narrative kept flipping between a focus on record coronavirus cases the rising death toll, versus possible progress over a vaccine.
Last week as well, the S&P 500 Index posted its highest intraday price since Feb. 21, the first day of the pandemic-induced selloff.
On Monday, yields, including for the 10-year Treasury, fell.
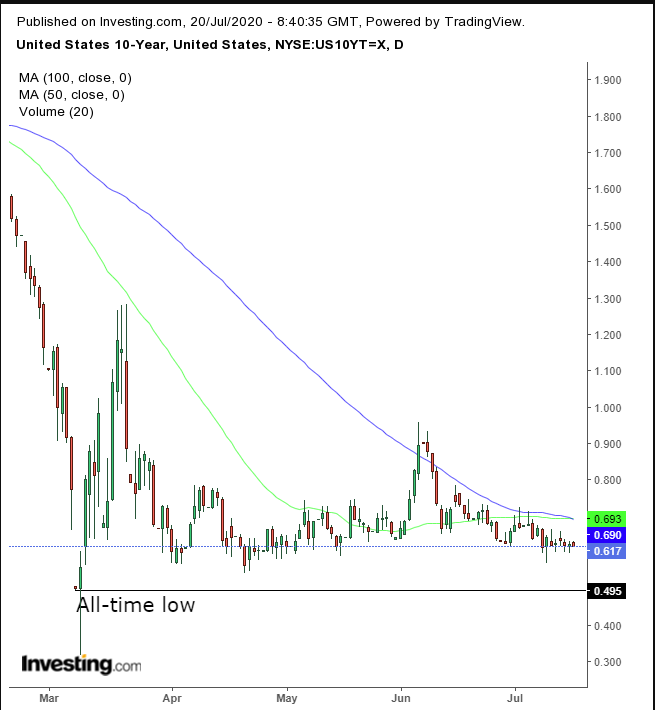
Rates are nearing the March 9, all-time low.
The euro strengthened, reaching a four-month high, as FX traders seemed to see progress in negotiations that stock investors didn’t recognize. It’s also fair to say that a rising euro pressures regional stocks.
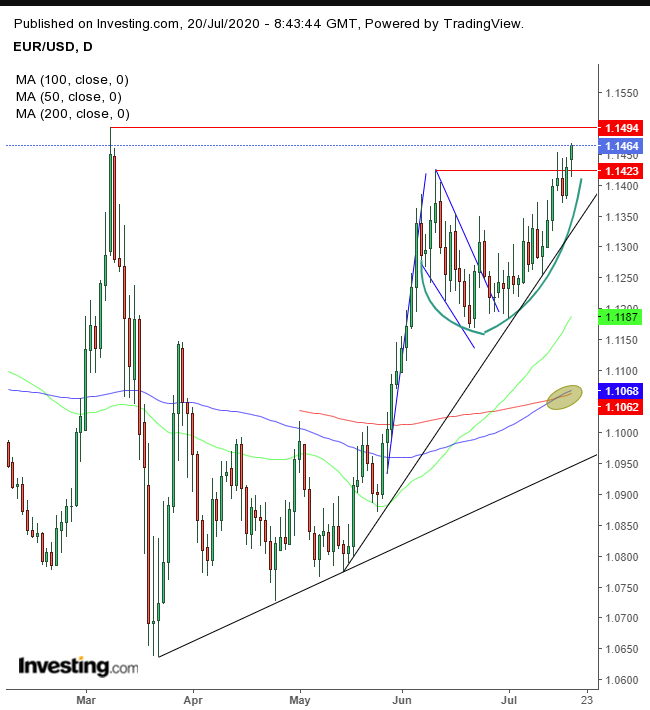
From a technical perspective, the single currency completed a rounding formation, as it headed back toward the 1.1500 psychological high, from where the currency plunged 7% between March 10 and March 19.
Gold advanced for a second day.
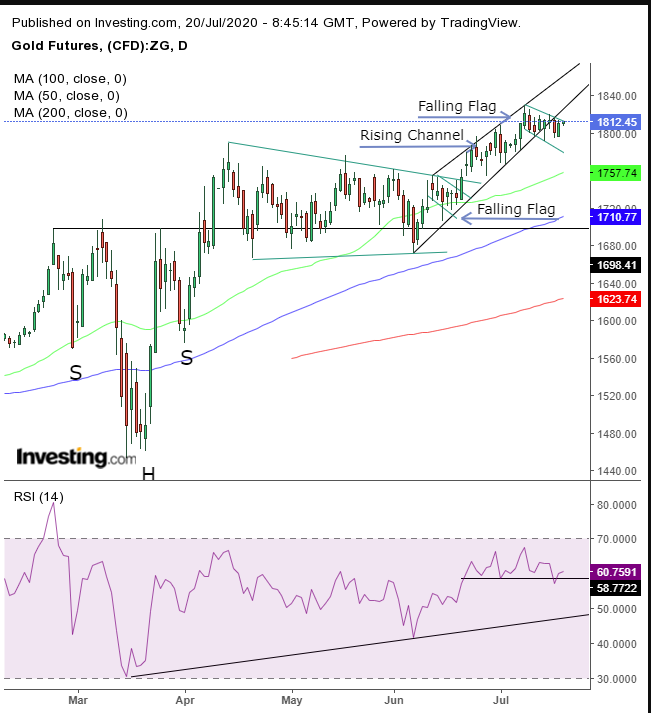
The yellow metal is straining against the top of a falling flag and a return to its narrow rising channel.
Oil edged lower for a third day, back toward $40, ahead of Wednesday’s oil inventories report.
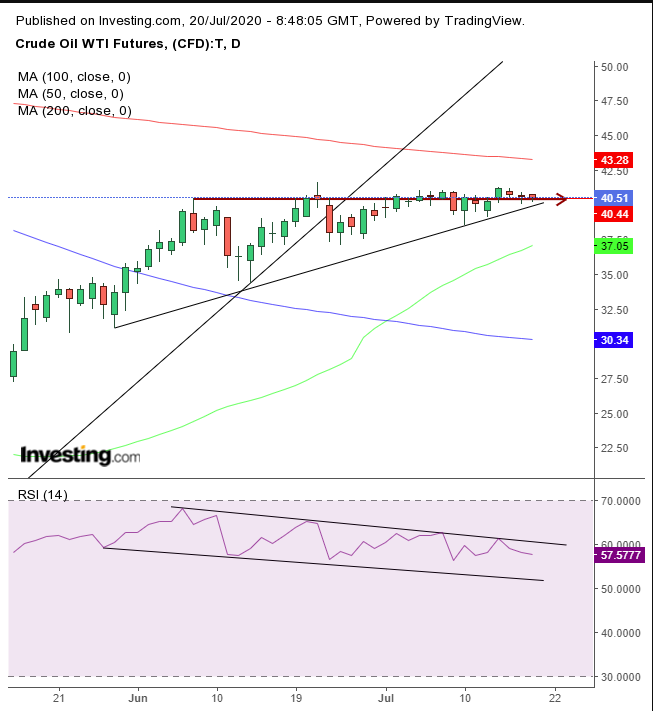
Technically, the WTI contract has been moving sideways for a month, which works against it, as bulls lose patience. The 200 DMA and the 50 DMA are squeezing the price, till it will squirt out of the six-week congestion. The RSI shows momentum has not been on its side.
Up Ahead
- Quarterly earnings season gathers steam: this week's reports included International Business Mahcines (NYSE:IBM), Blackstone Group (NYSE:BX), Microsoft (NASDAQ:MSFT) and Intel (NASDAQ:INTC)
- The EIA crude oil inventory release is due Wednesday.
- U.S. weekly jobless claims print on Thursday.
Market Moves
Stocks
- Futures on the S&P 500 Index fell 0.6%.
- The Stoxx Europe 600 Index declined 0.5%.
- The MSCI Asia Pacific Index climbed 0.1%.
- The MSCI Emerging Markets Index increased 0.2%.
Currencies
- The Dollar Index decline 0.1% to 95.82.
- The euro rose 0.1% to $1.1446.
- The British pound declined 0.1% to $1.2559.
- The Japanese yen weakened 0.2% to 107.24 per dollar.
- The offshore yuan strengthened 0.1% to 6.9866 per dollar.
Bonds
- The yield on 10-year Treasuries declined one basis point to 0.62%.
- The yield on 2-year Treasuries decreased less than one basis point to 0.14%.
- Germany’s 10-year yield jumped two basis points to -0.43%.
- Britain’s 10-year yield rose one basis point to 0.172%.
- Japan’s 10-year yield increased one basis point to 0.032%.
Commodities
- West Texas Intermediate crude declined 1.2% to $40.10 a barrel.
- Brent crude dipped 1.1% to $42.65 a barrel.
- Gold weakened 0.1% to $1,809.51 an ounce.
