-
Global stock decline highlights investor worry over US-China trade war moving from rhetoric to reality
- Dollar bounces from earlier decline
-
Saudi Arabia and Russia dispute with other OPEC members on production limits weighs on oil price
-
Germany coalition crisis drags euro lower
-
Final Brexit bill pressures sterling
Key Events
European stocks gapped down and US futures slid lower on Monday, following a selloff during the Asian session, as investors switched to risk-off trades in the wake of a fresh round of retaliatory measures as the US-China trade war escalated.
Futures tracking the NASDAQ 100 led the decline in the pre-US market open, while the dollar and Treasury yields were seen bouncing back from an earlier fall. Trade worries were also weighing on WTI crude, pressured by the looming OPEC summit later this week in Vienna.
It's no surprise then that the pan-European STOXX 600 was mostly dragged lower this morning by energy related stocks.
In the earlier Asian session regional equities opened on the back foot, stretching Friday's US losses into the new week. However, considering investors were under siege last week from multiple headwinds, we believe that decline shows a bullish footprint. The only catalyst that actually managed to have a significant impact on markets last week was the data from China, revealing an economic slowdown in the Asian country.
Japanese shares suffered the heaviest losses among regional peers—while a bank holiday spared Chinese equities from a likely sell off.
Japan's largest index, the TOPIX, suffered its worst performance in nearly three weeks, mainly due to a strengthening yen, driven both by trade worries and by a strong earthquake in Osaka, in the country's industrial heartland. Japan's benchmark index is always sensitive to the strength of the domestic currency, which inflates the price of exports. Perhaps, with investors so focused on the US-China trade narrative, the impact of a stronger yen is also magnified.
Australia’s S&P/ASX 200 bucked the trend, gaining 0.16 percent, mainly courtesy of financials stocks. The “Big Four” banks, which recently admitted to customer-related misconducts, spurring a selloff of their stocks—saw their shares gain ground. This upward move countered losses in the materials and energy sectors, which were weighted down by trade-related uncertainty and falling oil prices respectively.
Global Financial Affairs
The escalation of trade tensions on Friday between the US and China seems to have harnessed investor focus.
We noted on numerous occasions that investors have consistently disregarded geopolitical risk whenever the possible market implications weren't immediately clear. Before last Friday, a trade war between the world's two largest economies only represented a hypothetical threat. Then US President Donald Trump confirmed tariffs on $50 billion worth of Chinese imports, and Chinese officials responded with a 25 percent levy on $34 billion of US agricultural and automotive products starting on July 6. Now that both countries have pressed ahead with reciprocal trade tariffs, the threat of a trade war has solidified into a very real conflict.
Investors may still be struggling to understand the exact ramifications of these latest developments, nevertheless they're likely to become more cautious.

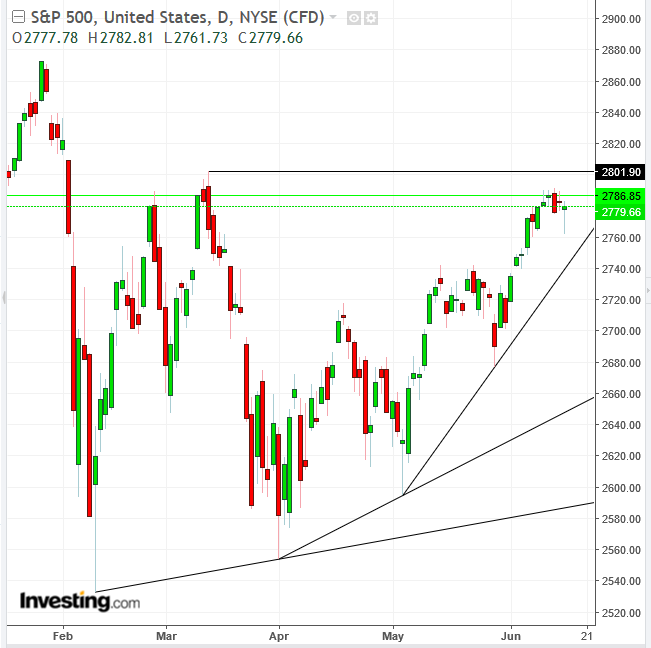
Technically, the S&P 500 posted a new high last Tuesday, at 2786.85—hitting a higher closing price than the March 9, 2786.57, thereby potentially confirming the uptrend since the February bottom. Still, it is having a difficult time advancing above the March 13, 2801.90 high price. Also, the continuous steeper incline of the trend suggests a correction toward the uptrend line—the question is: which one?

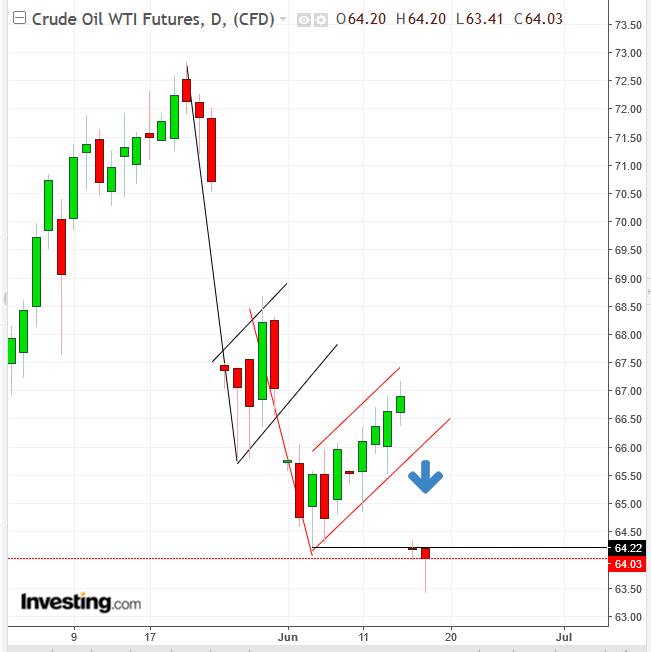
WTI crude continued to slip lower today as Saudi Arabia and Russia, both looking to increase production, prepare for a heated meeting with other OPEC members on this coming Friday, June 22. Technically, today's rebound forms a hammer, as bulls attempt to bid up the price of oil under the June 5, $64.22 low—the exact level at the time of writing.
Earlier the euro was sold off, after the governing coalition of German Chancellor Angela Merkel stumbled, threatened by a deterioration of the migration policy crisis.

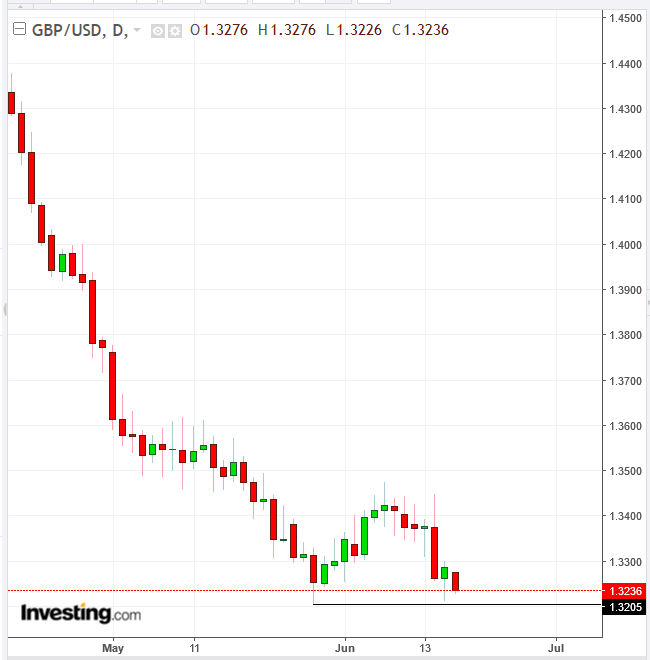
In the UK, an upcoming debate in the British Parliament on the Brexit withdrawal bill is pressuring the pound which has so far found support by Friday's hammer, on the support of the May 29, 1.3205 low price. Should that support fail, as all demand is absorbed, the 8 percent downtrend since mid-April is expected to resume, unimpeded.
Up Ahead
-
On Monday, the House of Lords takes on the Brexit withdrawal bill, after last week's key votes in the House of Commons, with details likely to emerge on the amendments that quelled a revolt by pro-EU Conservatives.
-
European Central Bank President Mario Draghi speaks at ECB’s Forum on Central Banking on Tuesday.
-
Data out Tuesday is expected to show a pick up in US housing starts in May, .
-
Mario Draghi, Reserve Bank of Australia Governor Philip Lowe, Bank of Japan Governor Haruhiko Kuroda and Fed Chairman Jerome Powell join a panel on central bank policy in Sintra, Portugal, on Wednesday.
-
Thailand, Philippines and Brazil central bank decisions are due on Wednesday.
-
Bank of England rate decision comes out on Thursday.
-
Also on Thursday: U.S. jobless claims, New Zealand GDP, South Korea export data.
-
The Organization of Petroleum Exporting Countries meets in Vienna on Friday.
Market Moves
Stocks
-
The STOXX Europe 600 slid 0.2 percent.
-
The MSCI World Index of developed countries slipped 0.2 percent to the lowest level in almost two weeks.
-
The MSCI Asia Pacific Index dropped 0.7 percent to the lowest level in almost three weeks.
-
Japan’s Nikkei 225 fell 0.8 percent to the lowest level in more than a week.
-
The MSCI Emerging Market Index lost 0.4 percent to the lowest level in more than six months.
-
The UK’s FTSE 100 gained 0.1 percent.
-
S&P 500 Futures dropped 0.4 percent to the lowest level in almost two weeks on the largest decrease in more than two weeks.
Currencies
-
The Dollar Index climbed 0.17 percent. A close at this level would mark the highest since July 12 2017.
-
The euro fell 0.3 percent to $1.1578.
-
The British pound slid 0.2 percent to $1.3245, the weakest level in seven months.
-
The Japanese yen inched 0.1 percent higher to 110.57 per dollar, the largest gain in more than a week.
Bonds
-
The yield on 10-year Treasuries dropped less than one basis point to 2.92 percent, the lowest level in more than two weeks.
-
Germany’s 10-year yield was unchanged at 0.40 percent, the lowest level in almost two weeks.
-
Britain’s 10-year yield lost one basis point to 1.328 percent, reaching the lowest level in almost two weeks on its fifth straight decline.
Commodities
-
West Texas Intermediate crude tumbled 1.5 percent to $64.07 a barrel, the lowest level in 10 weeks.
-
Gold fell 0.1 percent to $1,278.89 an ounce, the weakest level in about six months.
