
Vermilion Energy (TSX:VET)(NYSE:VET) stock fell to its 52-week low after reporting its third-quarter results and the oil and gas producer’s yield was pushed to as high as 8%! The market realized that the sell-off was overdone, as the stock has bounced about 4% higher since then.
Let’s review Vermilion’s actual results.
Q3 results
Vermilion generated $261 million of fund flows from operations, which was 34% higher than in Q2 2018 and 99% higher than in Q3 2017. The higher cash flow generation was due to greater production volumes and higher commodity prices.
Specifically, production grew 19% to 96,222 barrels of oil equivalent per day (boe/d) compared to Q2. The increase was primarily due to the full quarter contribution from the Spartan acquisition and new production added from this year’s drilling program.
Vermilion generates strong free cash flow from its Corrib gas operations in Ireland. Notably, it generated 9% less production to 51 million cubic feet per day or 8,563 boe/d from Corrib for the quarter due primarily to a planned plant turnaround (that impacted 53% of the reduction) and partly to natural declines (that impacted 47% of the reduction).
Outlook
Management plans to spend up to $530 million for exploration and development next year, which is estimated to lead to the production of 101,000-106,000 boe/d. The midpoint of the range implies production growth of 18% in 2019 compared to 2018 or 7% growth on a per-share basis.
Valuation
At $35.64 per share as of writing, Vermilion trades at about 5.9 times cash flow and at levels that are near its multi-year lows. The analyst consensus from Thomson Reuters has a 12-month target of $54.30 per share on the stock, which indicates the stock is undervalued by +30% on a forward basis or has a near-term upside of +50%.
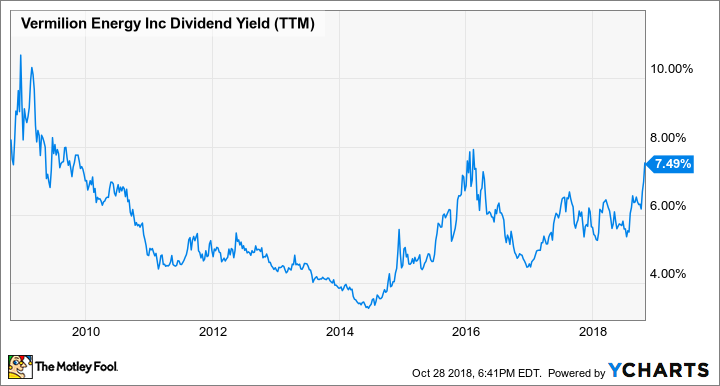
VET Dividend Yield (TTM) data by YCharts. Vermilion’s 10-year dividend yield range.
A nearly 8% dividend yield
Vermilion currently offers a delectable 7.74% dividend yield based on its monthly dividend of $0.23 per share or $2.76 annualized. The dividends declared in the first three quarters of the year equated to 46% of Vermilion’s fund flows from operations.
Investor takeaway
The net debt to annualized fund flows from operations in the first three quarters of the year was 2.48, which was comparable to 2.44 in the same period of 2017. It’s a positive that the ratio was reduced greatly to 1.95 in Q3 2018 compared to 2.62 in Q3 2017.
With stable production growth and higher commodity prices (i.e., oil price that’s stabilized above US$60 per barrel), there should be limited downside risk on Vermilion stock from current levels. Vermilion is attractive, offers a juicy 7.7% yield, and has near-term upside potential of +50%.
Fool contributor Kay Ng owns shares of VERMILION ENERGY INC.