Breaking News
Investing Pro 0
👀 Bezos, Buffett & Berkowitz: What's in Their Portfolios? Unlock Data

Chaos in Banks Buoy Short Sellers Hit by Tech Stocks’ Surge

Published Mar 31, 2023 12:12
Saved. See Saved Items.
This article has already been saved in your Saved Items
 
© Reuters
 
NDX
+2.58%
Add to/Remove from a Portfolio
Add to Watchlist
Add Position

Position added successfully to:

Please name your holdings portfolio
 
META
+3.70%
Add to/Remove from a Portfolio
Add to Watchlist
Add Position

Position added successfully to:

Please name your holdings portfolio
 
FRCB
+7.15%
Add to/Remove from a Portfolio
Add to Watchlist
Add Position

Position added successfully to:

Please name your holdings portfolio
 
SBNY
0.54%
Add to/Remove from a Portfolio
Add to Watchlist
Add Position

Position added successfully to:

Please name your holdings portfolio
 
IXIC
+2.19%
Add to/Remove from a Portfolio
Add to Watchlist
Add Position

Position added successfully to:

Please name your holdings portfolio
 
TSLA
+4.72%
Add to/Remove from a Portfolio
Add to Watchlist
Add Position

Position added successfully to:

Please name your holdings portfolio
 

(Bloomberg) -- Battered banks have been the most lucrative short bet in US stocks this quarter, while surging technology companies delivered the steepest losses, driving home how investors rotated back into growth shares as financial-sector turmoil swept markets. 

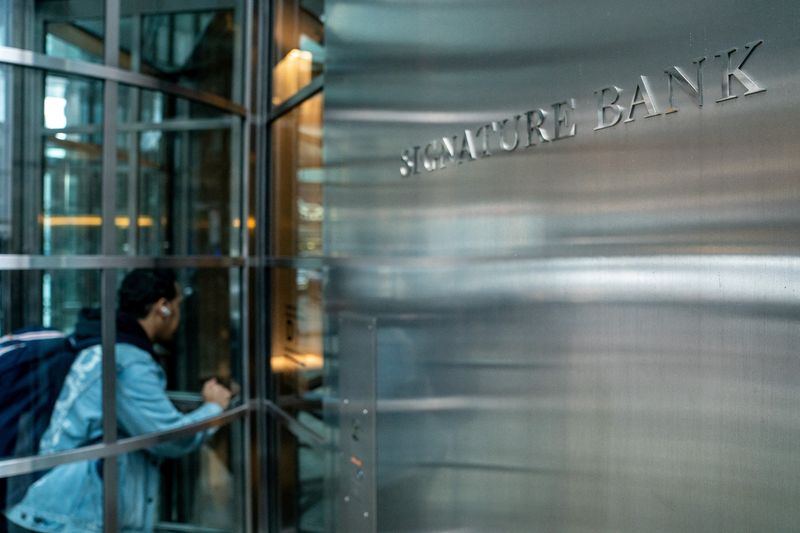
Speculators who sold borrowed shares of collapsed lender SVB Financial Group, wagering the stock would decline, reaped the biggest windfall — a mark-to-market profit of roughly $1.1 billion through Thursday, data compiled by S3 Partners show. First Republic Bank (NYSE:FRC) and Signature Bank (OTC:SBNY) rounded out the quarter’s three most profitable shorts. 

The results highlight the forces at play in markets to start 2023, which saw investors flood back to beaten-down tech stocks with strong balance sheets and cash flows. Meanwhile, the crisis that enveloped banks crushed those shares broadly.

“In recent memory, I’ve never seen banks in the top shorts,” said Ihor Dusaniwsky, S3’s head of predictive analytics, who has tracked the data since 2015. “Usually their price changes are not as dramatic as the tech and health-care stocks.” 

Stark Divide

Benchmark indexes lay out the stark divide in performance. The KBW Bank Index is down about 19% this year, for its worst quarter since early 2020. Meanwhile, the tech-heavy Nasdaq 100 Index is up about the same amount and entered a bull market Wednesday. It’s a stunning recovery for tech, after the Nasdaq 100 tumbled 33% in 2022, its worst year since the great financial crisis. 

For short sellers, the hit from the tech sector overwhelmed gains elsewhere: The group is on track for a loss of roughly $47 billion this quarter, according to S3. It follows last quarter’s loss of about $44 billion, a period when the S&P 500 Index was starting its recovery from last year’s lows.

Tesla (NASDAQ:TSLA) Inc. proved to be the short trade that dealt the most pain this quarter, with mark-to-market losses of more than $6.7 billion as the shares rebounded from a brutal 2022. It’s a big swing from last year, when investors betting against the electric-vehicle maker earned about $17 billion, making it the best-returning short target.

Nvidia (NASDAQ:NVDA) Corp., Meta Platforms Inc (NASDAQ:META). and Apple Inc (NASDAQ:AAPL). also lost short sellers billions of dollars this quarter.

A key part of the narrative is that US chip stocks that were pummeled last year have bounced back, spurring traders’ hopes that shares of semiconductor companies have indeed bottomed.

Next Step

The question now is whether it’s a temporary mean-reversion play to start the year or a green light to go all-in on those stocks, given widespread expectations for a recession this year.

In a sign of how pricey the shares have become, the ratio of chip stocks to regional banks is around its highest ever, data compiled by Bloomberg show. It’s at a level that rivals peaks before the bursting of the dot-com bubble in 2000, as well as in 2020 when traders piled into so-called growth stocks, powering major US indexes back to records after markets were shaken by the pandemic.

Coming into this week, the ratio of the Philadelphia Semiconductor Index versus the KBW Regional Bank Index saw the largest 10-day rate-of-change since 2001, at 28%, according to Jonathan Krinsky, chief market technician at BTIG. Now, he says a pullback wouldn’t be surprising for chip stocks.

“The tech trade will eventually run its course,” Krinsky said. “Once those rotations are done and long-only money managers can’t buy anymore tech, that’s when the group becomes vulnerable.”
 

Chaos in Banks Buoy Short Sellers Hit by Tech Stocks’ Surge
 

Related Articles

Add a Comment

Comment Guidelines

We encourage you to use comments to engage with users, share your perspective and ask questions of authors and each other. However, in order to maintain the high level of discourse we’ve all come to value and expect, please keep the following criteria in mind: 

  • Enrich the conversation
  • Stay focused and on track. Only post material that’s relevant to the topic being discussed.
  • Be respectful. Even negative opinions can be framed positively and diplomatically.
  •  Use standard writing style. Include punctuation and upper and lower cases.
  • NOTE: Spam and/or promotional messages and links within a comment will be removed
  • Avoid profanity, slander or personal attacks directed at an author or another user.
  • Don’t Monopolize the Conversation. We appreciate passion and conviction, but we also believe strongly in giving everyone a chance to air their thoughts. Therefore, in addition to civil interaction, we expect commenters to offer their opinions succinctly and thoughtfully, but not so repeatedly that others are annoyed or offended. If we receive complaints about individuals who take over a thread or forum, we reserve the right to ban them from the site, without recourse.
  • Only English comments will be allowed.

Perpetrators of spam or abuse will be deleted from the site and prohibited from future registration at Investing.com’s discretion.

Write your thoughts here
 
Are you sure you want to delete this chart?
 
Post
Post also to:
 
Replace the attached chart with a new chart ?
1000
Your ability to comment is currently suspended due to negative user reports. Your status will be reviewed by our moderators.
Please wait a minute before you try to comment again.
Thanks for your comment. Please note that all comments are pending until approved by our moderators. It may therefore take some time before it appears on our website.
 
Are you sure you want to delete this chart?
 
Post
 
Replace the attached chart with a new chart ?
1000
Your ability to comment is currently suspended due to negative user reports. Your status will be reviewed by our moderators.
Please wait a minute before you try to comment again.
Add Chart to Comment
Confirm Block

Are you sure you want to block %USER_NAME%?

By doing so, you and %USER_NAME% will not be able to see any of each other's Investing.com's posts.

%USER_NAME% was successfully added to your Block List

Since you’ve just unblocked this person, you must wait 48 hours before renewing the block.

Report this comment

I feel that this comment is:

Comment flagged

Thank You!

Your report has been sent to our moderators for review
Continue with Google
or
Sign up with Email