* Stocks up as Xi seen conciliatory on trade
* Russian rouble touches lowest since late 2016 versus USD
* Oil adds near 4 pct as trade war fears ebb
By Rodrigo Campos
NEW YORK, April 10 (Reuters) - Global equity markets rose for the fifth session in six and the Japanese yen fell on Tuesday as Chinese President Xi Jinping's promise to cut import tariffs eased investor concerns about an escalating U.S.-China trade row.
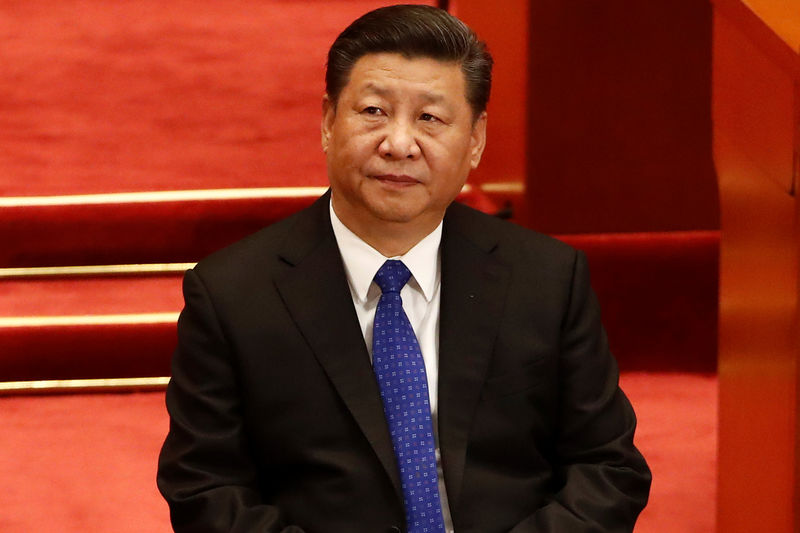
Xi, speaking at a forum, vowed to open China's economy further, protect intellectual property of foreign firms and he criticized a "Cold War mentality" as obsolete, in his first public comments since the trade dispute with U.S. President Donald Trump's administration erupted. in the trading session in New York, Trump said via Twitter that he was "Very thankful for President Xi of China's kind words regarding tariffs and automobile barriers."
Xi's comments prompted a largely positive reaction in financial markets, which have been rattled on fears that tit-for-tat U.S.-China tariffs will escalate into a full-scale trade war that would threaten global growth.
"What you are seeing in the market is an alleviation of trade war fears and people trying to get back in and reposition themselves for what they hope - no trade war," said Robert Pavlik, chief investment strategist at SlateStone Wealth LLC in New York.
The Dow Jones Industrial Average .DJI rose 435.03 points, or 1.81 percent, to 24,414.13, the S&P 500 .SPX gained 43.22 points, or 1.65 percent, to 2,656.38 and the Nasdaq Composite .IXIC added 130.92 points, or 1.88 percent, to 7,081.27. pan-European FTSEurofirst 300 index .FTEU3 rose 0.87 percent and MSCI's gauge of stocks across the globe .MIWD00000PUS gained 1.36 percent. market stocks rose 1.06 percent. MSCI's broadest index of Asia-Pacific shares outside Japan .MIAPJ0000PUS closed 1.27 percent higher, while Japan's Nikkei .N225 rose 0.54 percent. markets rose sharply on hopes that the trade dispute may be resolved without greater damage to the global economy. has been another huge day," said Bill Baruch, president of Blue Line Futures in Chicago. "There's soothing trade war fears, geopolitics, and a weaker dollar at play."
U.S. crude CLc1 rose 3.66 percent to $65.74 per barrel and Brent LCOc1 was last at $71.22, up 3.74 percent on the day.
Xi's comments also lifted the U.S. dollar against the Japanese yen. main driver was the speech by China's President overnight that helped to calm some concerns about a looming trade war," said Omer Esiner, chief market strategist with Commonwealth Foreign Exchange in Washington.
The Japanese yen weakened 0.38 percent versus the greenback at 107.19 per dollar, while Sterling GBP= was last trading at $1.4181, up 0.37 percent on the day.
The dollar index .DXY fell 0.26 percent, with the euro EUR= up 0.31 percent to $1.2357. 10-year notes US10YT=RR last fell 4/32 in price to yield 2.7991 percent, from 2.786 percent late on Monday. 30-year bond US30YT=RR last /32 in price to yield 3.0174 percent, from 3.017 percent late on Monday.
RUSSIA FALLS FURTHER
Russian assets extended Monday's slide as investors digested the new round of U.S. sanctions targeting the country's tycoons. The rouble plunged 3.9 percent against the dollar and touched 63.925 per dollar, its lowest since late 2016. in Moscow calculated in U.S. dollars .IRTS fell as much as 4.8 percent after dropping more than 11 percent on Monday, but shaved most of Tuesday's loss to end down 0.4 percent. of Rusal, the aluminum giant highlighted prominently in the sanctions alongside its boss Oleg Deripaska, fell a further 8.7 percent in Hong Kong 0486.HK after slumping 50 percent on Monday.
<^^^^^^^^^^^^^^^^^^^^^^^^^^^^^^^^^^^^^^^^^^^^^^^^^^^^^^^^^^^ GRAPHIC-Global assets in 2018
http://tmsnrt.rs/2jvdmXl GRAPHIC-Emerging markets in 2018
http://tmsnrt.rs/2ihRugV GRAPHIC-World FX rates in 2018
http://tmsnrt.rs/2egbfVh GRAPHIC-MSCI All Country World Index Market Cap
http://tmsnrt.rs/2EmTD6j GRAPHIC-Russian rouble lowest since Dec. 2016
https://tmsnrt.rs/2qjmYpN
^^^^^^^^^^^^^^^^^^^^^^^^^^^^^^^^^^^^^^^^^^^^^^^^^^^^^^^^^^^>
