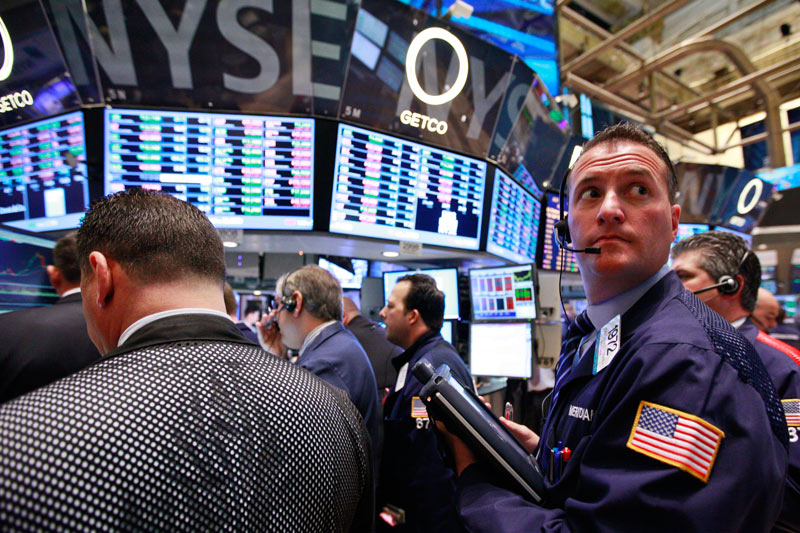
* U.S. stocks open higher, boosting global shares
* Euro, sterling gain while dollar drops
* Asia shares ex-Japan cheered by upbeat China data (Updates to U.S. trading open; changes byline, dateline, previously LONDON)
By Stephanie Kelly
NEW YORK, Jan 2 (Reuters) - Global share markets received a boost from strong gains in U.S. equities and surprisingly upbeat Chinese manufacturing data on Tuesday, the first trading day of 2018, while the U.S. dollar fell to its weakest in over three months against key currencies.
MSCI's gauge of stocks across the globe .MIWD00000PUS gained 0.64 percent. The index set scores of record highs and rose by one-fifth in value last year. (http://reut.rs/2zLv6kT)
On Wall Street, equity indexes advanced, buoyed by gains in technology and consumer discretionary stocks. stock indexes closed 2017 with their best performance since 2013. In the U.S. market, the advance came amid strong economic growth and corporate earnings, low interest rates and hopes, now realized, of U.S. corporate tax cuts.
"The first week of trading usually suggests the overall trend of the markets which we expect to be positive," Peter Cardillo, chief market economist at First Standard Financial in New York, wrote in a note.
The Dow Jones Industrial Average .DJI rose 73.3 points, or 0.3 percent, to 24,792.52, the S&P 500 .SPX gained 18.1 points, or 0.68 percent, to 2,691.71 and the Nasdaq Composite .IXIC added 88.45 points, or 1.28 percent, to 6,991.84.
Shares also rose in Asia. Shanghai blue chips .CSI300 climbed 1.41 percent and MSCI's 24-country emerging market stock index .MSCIEF jumped to a multi-year high after the Caixin index of Chinese industry rose to a four-month high of 51.5 in December, confounding forecasts for a decline. pan-European FTSEurofirst 300 index .FTEU3 , however, was a rare laggard and lost 0.23 percent.
FALLING DOLLAR
The dollar index .DXY , tracking the greenback against a basket of major currencies, fell 0.32 percent. It was hampered by market expectations of a slower pace of interest rate increases by the Federal Reserve amid a tepid U.S. inflation picture. remain skeptical about the Fed's outlook for three additional interest rate increases this year, especially given the extremely benign inflation backdrop in the U.S.," said Omer Esiner, chief market analyst, at Commonwealth Foreign Exchange in Washington.
The dollar had already hit a three-month low .DXY on Friday, bringing its losses for 2017 to 9.8 percent, its worst performance since 2003.
Other currencies gained. The euro EUR= rose 0.38 percent to $1.2054 and hit a four-month high on Tuesday after data showed that euro zone manufacturers ramped up activity last month at the fastest pace in more than two decades. Japanese yen strengthened 0.45 percent versus the greenback at 112.16 per dollar, while sterling GBP= was last trading at $1.3587, up 0.64 percent on the day.
U.S. Treasury yields rose in line with European government yields. A European Central Bank official said the bank's massive bond purchase program might not continue later this year. 10-year notes US10YT=RR last fell 15/32 in price to yield 2.4651 percent, from 2.411 percent late on Friday.
The 30-year bond US30YT=RR last fell 44/32 in price to yield 2.8097 percent, from 2.741 percent late on Friday.
U.S. crude CLcv1 fell 0.38 percent to $60.19 per barrel and Brent LCOcv1 was at $66.37, down 0.75 percent. Oil prices earlier had enjoyed their strongest start to a year since 2014 amid large anti-government rallies in Iran and ongoing supply cuts led by OPEC and Russia. CMCU3 lost 0.21 percent to $7,232.00 a tonne, but that follows a rise of 31 percent in 2017 to a four-year top.
Spot gold XAU= added 0.8 percent to $1,312.61 an ounce, after advancing by 13 percent in 2017 for its best performance in seven years.
<^^^^^^^^^^^^^^^^^^^^^^^^^^^^^^^^^^^^^^^^^^^^^^^^^^^^^^^^^^^ Global assets in 2017
http://reut.rs/1WAiOSC Global currencies vs. dollar
http://tmsnrt.rs/2egbfVh Global bonds dashboard
http://tmsnrt.rs/2fPTds0 Emerging markets in 2017
http://tmsnrt.rs/2ihRugV
^^^^^^^^^^^^^^^^^^^^^^^^^^^^^^^^^^^^^^^^^^^^^^^^^^^^^^^^^^^>
