- U.S. futures slip on fears of further U.S. bans on Chinese companies
- Yields ease after Fed’s Bullard comments on potential rate cuts
- Pound hit by MPs rebuke to prospect of second Brexit referendum
Key Events
European stocks were trading in a holding pattern and futures on the S&P 500, Dow and NASDAQ 100 pared much of yesterday’s gains at the opening, as investors awaited further trade war developments after reports the Trump administration was mulling extending Huawei-style restrictions to Chinese video surveillance firm Hikvision.
By the late European morning session, the STOXX 600 managed to climb into green territory—with personal and household goods offsetting declines in real estate.
Earlier, the news of potential additions to the U.S. trade blacklist weighed more markedly on Asian markets. China’s Shanghai Composite slipped 0.49% and Japan’s Nikkei 225 erased a 0.48% climb at the open, to close barely positive (+0.05%).
Conversely, Australia’s S&P/ASX 200 (+0.16%) held near an 11-year high after the announcement of looser home mortgage requirements and of a possible interest rate cut from the Reserve Bank of Australia in June.
Global Financial Affairs
In yesterday’s U.S. session, stocks rebounded on the news the White House had partly lifted restrictions on Huawei for three months, boosting trade-sensitive sectors.
The S&P 500 sealed a 0.85% gain. Materials (+1.54%) outperformed, followed by Technology (+1.23%) and Industrials (+1.18%). Consumer Staples (-0.21%) was the only sector in red, while Utilities (+0.19%) fared as the second-worst performer after hitting an all-time high on Monday.
Technically, the SPX climbed toward the top of a pennant and found resistance by the 50 DMA, and the 100 DMA stopped below the 200 DMA.

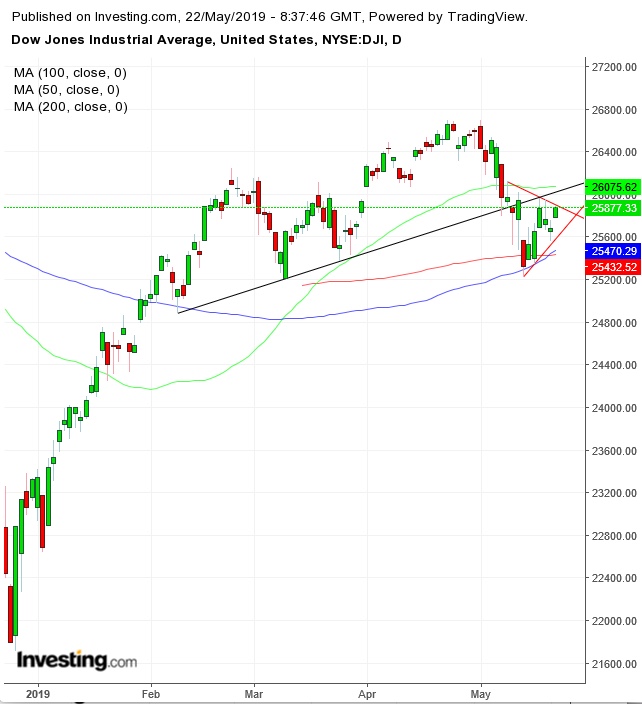
The Dow Jones Industrial Average bounced 0.77% to the top of its pennant-shaped trading pattern, where it reiterated the resistance since Friday. Meanwhile, the climb pulled the 100 DMA over the 200 DMA.
The NASDAQ Composite leaped +1.08%, bouncing off the bottom of its own pennant formation, yanking the 100 DMA over the 200 DMA.
The Russell 2000 (+1.27%) outperformed its U.S. peers, resuming a trend that contradicts the market narrative whereby trade is the single biggest headwind at present. We've suggested that, perhaps, the strengthening dollar is the real story.

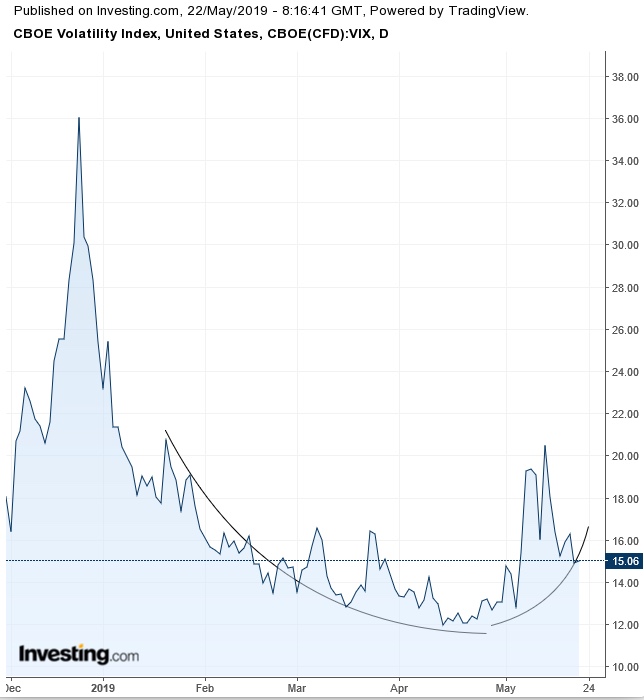
Meanwhile, the VIX fell to its lowest level in two weeks—but it may have followed a trend reversal, suggesting the current decline is a correction within a rising trend.
Overall, we have been warning against trading based on the U.S.-China trade narrative since the dispute between the two economic powers started about a year ago, and as recently as yesterday we advised traders not to buy into risk-on, arguing that the temporary lift on the Huawei ban seemed like a small band aid over an expanding wound.
Elsewhere, St. Louis Fed President James Bullard told Bloomberg that it’s premature to talk about a rate cut but admitted the Fed's recent hike may have been too restrictive—which made the current Treasury rate suddenly look attractive. The Increase in Treasurys demand that ensued pushed yields on 10-year notes back lower after a three-day advance.
The greenback advanced alongside government bonds ahead of the release of minutes from the last FOMC monetary policy meeting, resuming an advance on a breakout of an ascending channel, as it takes on the April 26 peak. This morning, though, yields were seen slightly higher and the USD mildly lower.
On the other side of the Atlantic, the British pound fell to the lowest level since Jan. 3 after U.K. Prime Minister Theresa May offered parliament a vote on holding a second Brexit referendum. The news initially propelled cable higher, but gains quickly turned into losses after key conservative lawmakers criticized the move, stepping up calls for May's resignations.
In commodities, oil fell for the second day on rising U.S. crude inventories.
Up Ahead
- Minutes from the April 30-May 1 FOMC policy meeting will be released today.
- On Thursday, the ECB publishes its account of the April monetary policy decision.
- Counting of votes from the Indian general elections takes place on Thursday as Prime Minister Narendra Modi attempts to secure a second term.
- The European Parliament holds continent-wide elections on May 23-26.
Market Moves
Stocks
- The U.K.'s FTSE 100 climbed 0.45%
- The MSCI Emerging Market Index gained less than 0.05%.
Currencies
- The Dollar Index climbed less than 0.1%
- The euro declined 0.1% to $1.1153, the weakest in almost four weeks.
- The Japanese yen strengthened 0.1% to 110.41 per dollar, the largest increase in more than a week.
- The onshore yuan weakened 0.1% to 6.911 per dollar.
Bonds
- The yield on 10-year Treasurys slid one basis point to 2.42%.
- The yield on 2-year Treasuries dropped one basis point to 2.24%, the first retreat in a week.
- Germany’s 10-year yield declined one basis point to -0.07%.
- Japan’s 10-year yield slipped one basis point to -0.056%.
Commodities
