- U.S. futures, European shares rally on trade bullishness
- Global bonds rise as Treasurys sell off, with yields signaling a potential drag on stocks
- Oil climbs on Saudi Aramco IPO
Key Events
Futures on the S&P 500, Dow and NASDAQ 100 rallied this morning while global bonds edged higher on a Treasurys sell off. Driving the surge was a boost in trade optimism, after U.S. President Donald Trump said on Friday he could sign a deal with China by the end of the month and, on Sunday, Commerce Secretary Wilbur Ross promised U.S. companies a license to sell components to Huawei “very shortly."
Contracts on all four major U.S. indices gapped up and extended an advance, building on Friday’s fresh records for the S&P 500 and the NASDAQ Composite.
Europe's STOXX 600 also started the week on the right foot, climbing 0.89% by late European morning. Fifteen out of 19 industries advanced, led by miners and car makers ahead of an expected trade deal between the world’s two largest economies. The climb marked the second day of gains, to the highest level since Jan. 23 2018—just 3.15% below its April 15 2015 record.
Earlier in Asia, Hong Kong’s Hang Seng (+1.65%) rallied to a three-month high on trade hopes, even as unrest in the city resumed, with China urging a tougher response to what it characterized as “wanton violence.”
South Korea’s KOSPI (+1.43%) gained and the won reached a four-month high, having suffered the most from the trade fallout among the region's currencies.
Global Financial Affairs
On Friday, U.S. equities closed the week higher, to bring the current rally to over four weeks. Unlike the SPX and tech benchmark, however, the Dow ended 0.04% below its July 15 record close.

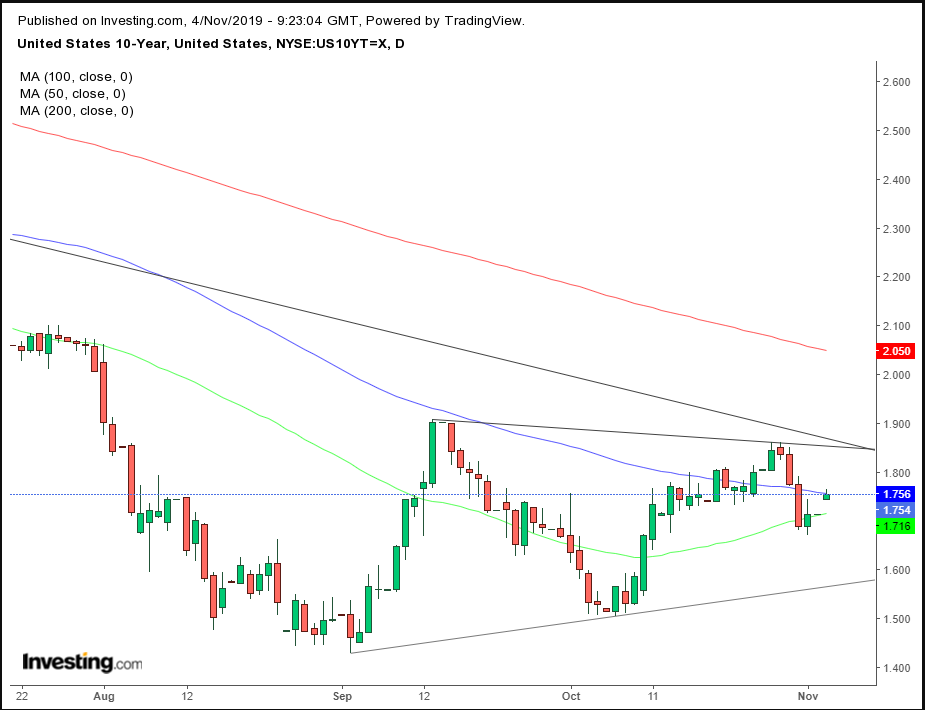
Yields on 10-year Treasurys jumped on risk-on but slipped from their highs, pressured by the 100 DMA. The pattern for rates since the Sept. 3 bottom has been forming a symmetrical triangle—one in which both Treasury bulls and bears hold a stake.
While this suggests a breakout is optional on either side, the pattern emergence below the long-term downtrend line since November 2018, “guarded” by the 200 DMA, strengthens the case for a downside breakout. If that scenario plays out, investors might start to call into question the highest U.S. stock prices in history.

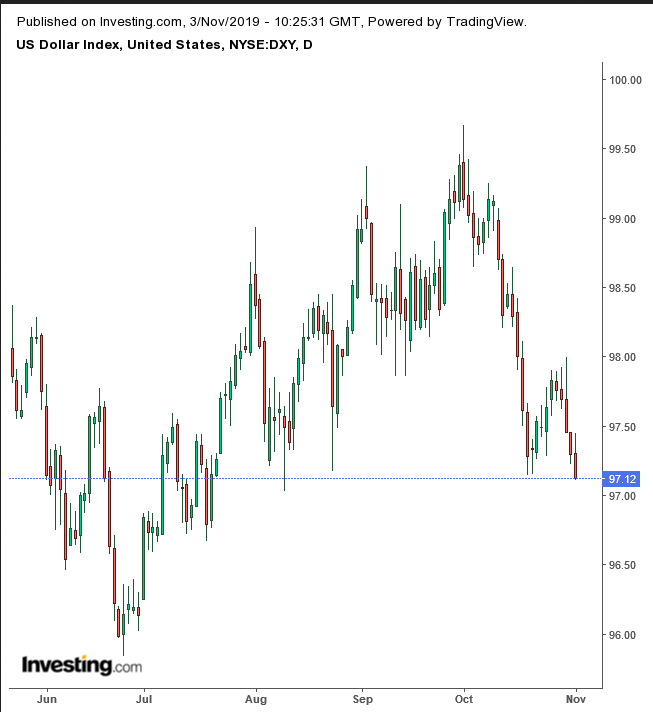
The Dollar Index has found its footing after a five-day selloff that reminded traders of the four-day sharp tumble mid last month, despite Friday's upbeat employment report.
Considering Wednesday's interest rate cut was all but fully priced in, perhaps the continued selloff reflects elevated levels of corporate indebtedness, suggesting a continued path to lower rates, regardless of what Fedspeak suggested last week. Technically, the dollar registered a second low on Thursday, completing a short-term downtrend, after falling below the uptrend line since the February 16 2018 low in mid-October, followed by a decline below the 200 DMA on Wednesday.
Oil prices leaped after Saudi Aramco's IPO officially kicked off on Sunday, with the Saudi government boosting incentives to ensure a successful flotation. Valuations for the stock, which is likely to start trading in Riyadh next month, vary widely.
Up ahead
- Earnings are due from companies including: Uber (NYSE:UBER) and Marriott International (NASDAQ:MAR) on Monday; Singapore Airlines (SI:SIAL) on Tuesday; Softbank (T:9984) and BMW (DE:BMWG) on Wednesday; Walt Disney (NYSE:DIS), Toyota (T:8015) and Deutsche Telekom (DE:DTEGn) on Thursday.
- U.S. durable goods data is due Monday along with factory orders.
- Regional Fed presidents including Charles Evans, John Williams and Patrick Harker speak at events on Wednesday.
- Central bank monetary decisions are due on Tuesday in Australia and Thursday in the U.K..
Market Moves
Stocks
Currencies
Bonds
Commodities
