- U.S. futures, European shares tumble on China's threats to cut metal supply
- Key U.S. yield curve inversion deepens to widest level since 2007
- Oil plummets on Trump's softening cues on Iran
Key Events
Global stocks and futures on the S&P 500, Dow and NASDAQ 100 tracked plunging yields this morning, as safe haven assets from Treasurys to gold and the Japanese yen leaped higher.
The STOXX 600 was down 1.45% by late European morning, with miners and banks taking a hit on reports that China is ready to cut back the supply of rare metals in retaliation for the latest U.S. trade salvos.
In the earlier Asian session, regional stocks posted some heavy losses on U.S. President Donald Trump's threats of a trade tariff escalation. After local investors had brushed off Trump's comments on Tuesday, they seemed to catch up with the wider market sentiment as a lull in economic data gave them nothing to cling to.
South Korea’s KOSPI underperformed, suffering the largest drop in two weeks (-1.25%), followed closely by Japan’s Nikkei 225 (-1.22%). Conversely, China's Shanghai Composite (+0.16%) outperformed, continuing to disregard trade risk and resuming its congestion since May 7 after topping out.
Global Financial Affairs
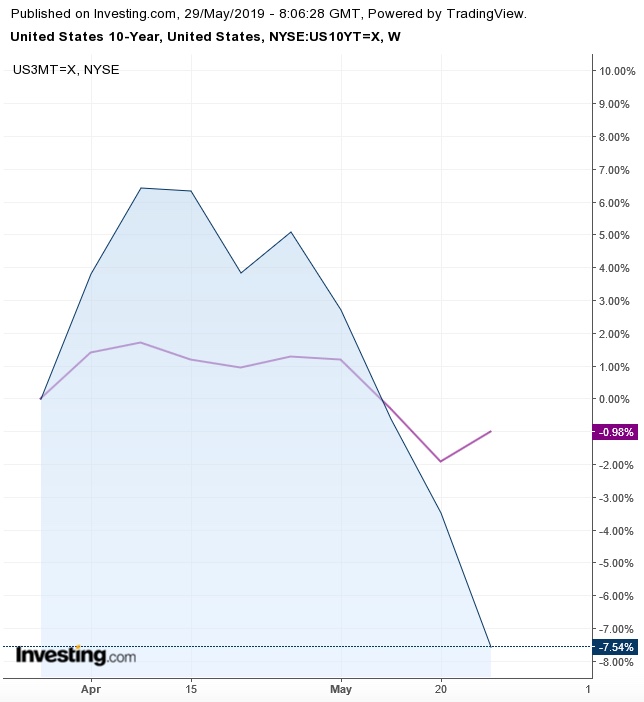
Yesterday, U.S. equities tumbled to the lowest level since March, as falling yields exacerbated concerns about an economic slowdown, with the 10-year to 3-month curve inversion deepening to the widest level since 2007.
The S&P 500 (-0.84%) dropped with all sectors but Communication Services (+0.44%). However, the fact that Utilities (-1.64%) underperformed is noteworthy. According to the recent market narrative, equities dropped due to an increasing outlook for a recession, which means defensive shares should have sealed the best performance—not the worst.

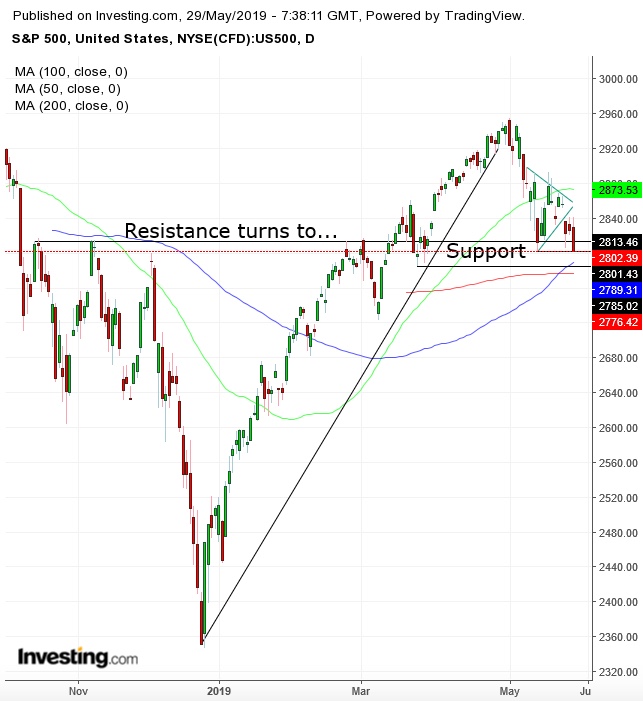
Technically, the index extended a downside breakout of a pennant—a continuation pattern, reaching the lowest closing price since March 25. However, it may find support at 2,800, a level we expected to be a resistance after the December bottom. This level has attracted a lot of interested parties since mid-October. We also find the 100 and 200 DMAs right below.
The Dow Jones Industrial Average (-0.93%) underperformed its peers, as stocks of multinational companies stand to lose the most from trade jitters. Technically, the price closed below the 200 DMA, as it develops the right shoulder of a H&S top.

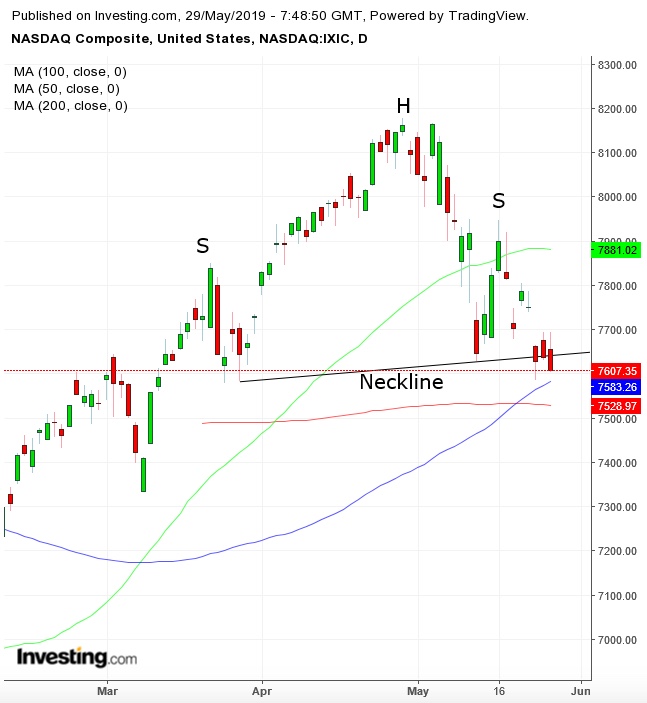
The NASDAQ Composite (-0.39%) outperformed, suggesting some investors are taking advantage of the recent sharp selloff. Technically, however, the tech-heavy index may have completed a H&S top, though the 100 and 200 DMAs provide support above the key 7,500 level.
The Russell 2000 slid 0.57%. It found support by the Feb. 7 and March 25 lows. However, it completed a pennant, bearish within a drop—with the 100 DMA drawing the lower boundary of the pattern. If the small-cap benchmark slips below the 1,494 level, it would complete a double-top pattern.

Ten-year yields reached the lowest level since Sep. 25, 2017, pushing the curve with 3-month yields to the widest inversion since 2007. This is the most watched yield ratio as it provides the closest proxy of a recession—which it historically precedes by 18 months.
Government bond yields also suffered globally, with benchmark yields sliding to the lowest level since 2016 in Japan, to a record low in New Zealand and below the central bank’s policy rate in Australia.
In commodities, oil tumbled as signals, from Trump, of an opening on possible negotiations with Iran added to trade and growth concerns to drag prices lower, outweighing the effect of production cuts and supply headwinds.
Up Ahead
- Revised first-quarter GDP numbers are due in the U.S. on Thursday.
- Also on Thursday, U.S. data including personal income and spending and initial jobless claims will provide more clues on the outlook for the world’s biggest economy and the Fed’s monetary policy path.
- China provides figures on its May economic performance on Friday, with economists anticipating the official manufacturing PMI will tick down to 49.9 and signal a contraction amid the worsening trade war with the U.S.
Market Moves
Stocks
- The MSCI Asia Pacific Index fell 0.7%.
- The MSCI Emerging Market Index dropped 0.5%, to the lowest in almost 20 weeks.
Currencies
- The Dollar Index advanced 0.06% bouncing from a similar move into negative territory.
- The euro slid 0.1% to $1.1153.
- The British pound lost 0.1% to $1.2643.
- The onshore yuan weakened 0.1% to 6.916 per dollar.
Bonds
- The yield on 10-year Treasurys slipped four basis points to 2.23%, the lowest in 20 months.
- The yield on 2-year Treasurys declined four basis points to 2.08%, the lowest in more than 15 months.
- Italy’s 10-year yield climbed one basis point to 2.703%, the highest in a week.
- Australia’s 10-year yield fell five basis points to 1.4855%, the lowest on record.
Commodities
- West Texas Intermediate crude declined 1.3% to $58.37 a barrel.
- LME nickel edged less than 0.05% lower to $12,120 per metric ton.
- Gold increased 0.3% to $1,283.94 an ounce.
- Corn advanced 3.5% to $4.35 a bushel, the highest in a year.
