
Key Events
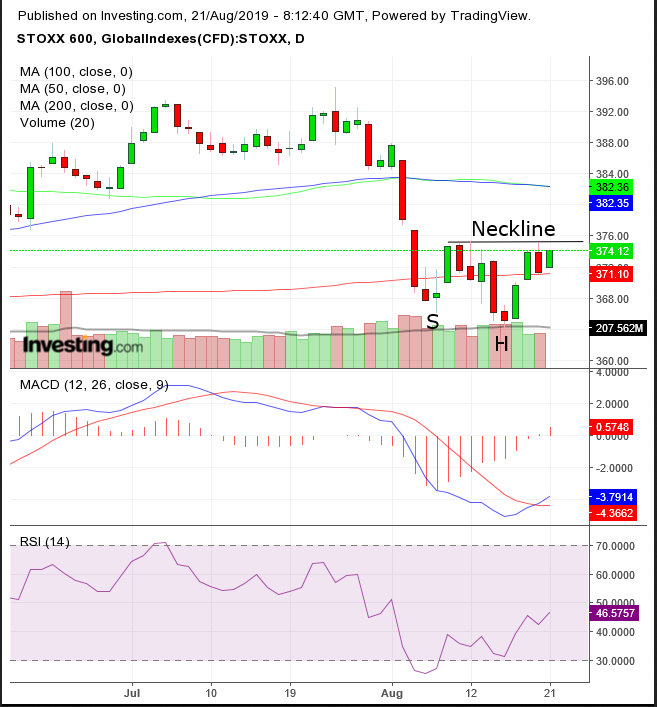
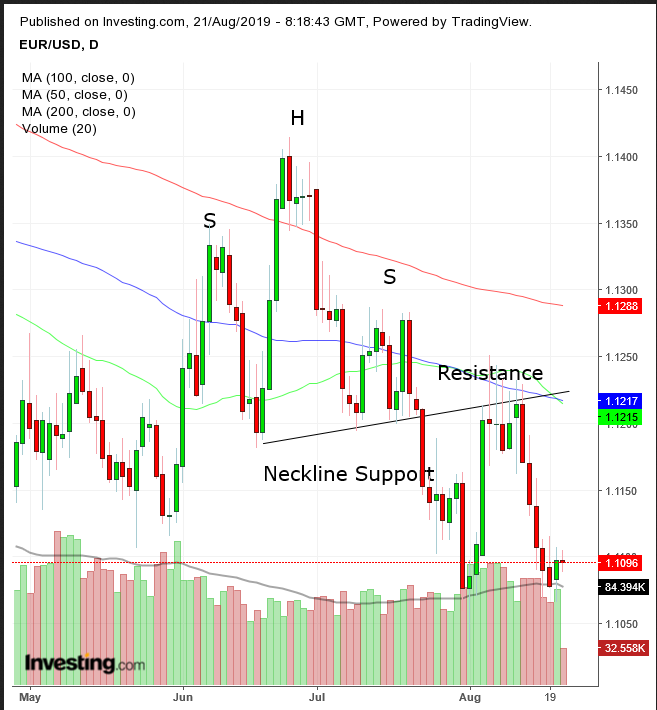
Futures on the S&P 500, Dow and NASDAQ 100 jumped with European stocks this morning as traders returned to risky assets, shrugging off mixed U.S.-China trade signals, renewed growth worries and political uncertainty in Italy.Upbeat pre-market earnings results from consumer heavyweights Lowe’s (NYSE:LOW)(NYSE:LOW) and Target (NYSE:TGT) (NYSE:TGT) helped investors shift to a bullish mode and push U.S. contracts higher.STOXX 600 Daily ChartAs for Europe's STOXX 600, it was automobile companies that mostly lead the gains, buoyed by reports of progress on merger talks between Fiat Chrysler (MI:FCHA) andRenault (PA:RENA).Plans by Germany to ease a surcharge on income taxes also helped the pan-European index retest levels near two-week highs—which, if breached, would complete a small H&S bottom. Both the MACD and RSI support the case for a short-term reversal. Conversely, the volume play doesn’t follow the reversal structure.EUR/USD Daily ChartThe euro was little changed after posting a—seemingly—counterintuitive leap forward after Italy’s Prime Minister Giuseppe Conte resigned, formally starting a governmental crisis that will lead to either a new coalition government or new general elections. Technically, the price of the single currency found support at the month’s lows, after a five-day selloff that followed a test to the neckline of a H&S continuation pattern. However, similarly to what was observed in the equity benchmark, the volume did not fit a typical H&S pattern.In the earlier Asian session, Australia’s S&P/ASX 200 (-0.94%) lagged after a two-day winning streak. Miners and retailers weighed on the average on renewed recession fears.South Korea’s KOSPI (+0.22%) outperformed, followed by Hong Kong’s Hang Seng(+0.15%), despite news Chinese e-commerce giant Alibaba (NYSE:BABA) delayed its planned $15bn share listing in the city due to mounting political instability.Global Financial Affairs
U.S. stocks slid lower on Tuesday, yielding to the contrasting pressures of potential fiscal and policy stimulus on one side and underlying recession risks on the other.
President Donald Trump fed recession fears by admitting the tariff dispute with China could halt growth. However, in a separate move that was most likely aimed at quelling the same growth concerns, he boosted stimulus hopes on the fiscal front, confirming he was considering "various tax reductions"—after he increased pressure on the Fed to implement a substantial interest rate cut.
On the trade front, U.S. Secretary of State Mike Pompeo said the trade war could end by next year, while Trump warned on Monday it would be hard to reach a deal if Hong Kong turns into “another Tiananmen Square (NYSE:SQ).”
All these come ahead of the closely-watched publication of the minutes from the Fed's latest monetary policy meeting, with investors hoping that both the meeting accounts and the upcoming speech by Chairman Jerome Powell at the annual Jackson Hole summit will bolster the case for continued policy easing.

UST 10-Year Daily Chart
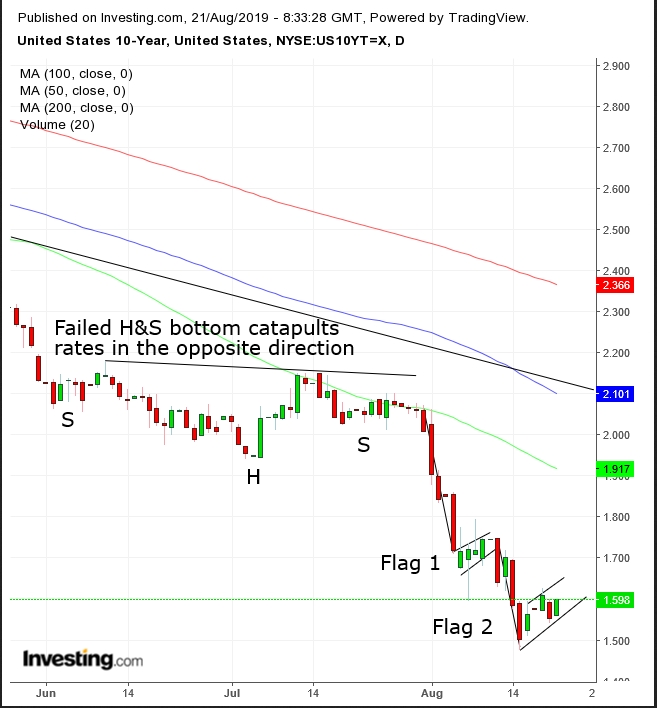
Meanwhile, the yield on 10-year Treasurys edged higher this morning after dropping yesterday, extending a consolidation pattern in the shape of a rising flag, bearish in the downtrend. The move comes after a completion of a small bearish flag earlier in the month. A downside breakout may put pressure on equities again. The back-to-back continuation patterns developed after a failed H&S bottom, whose failure backtracked market dynamics, catching investors on the wrong side of the market.

USD/JPY Daily Chart
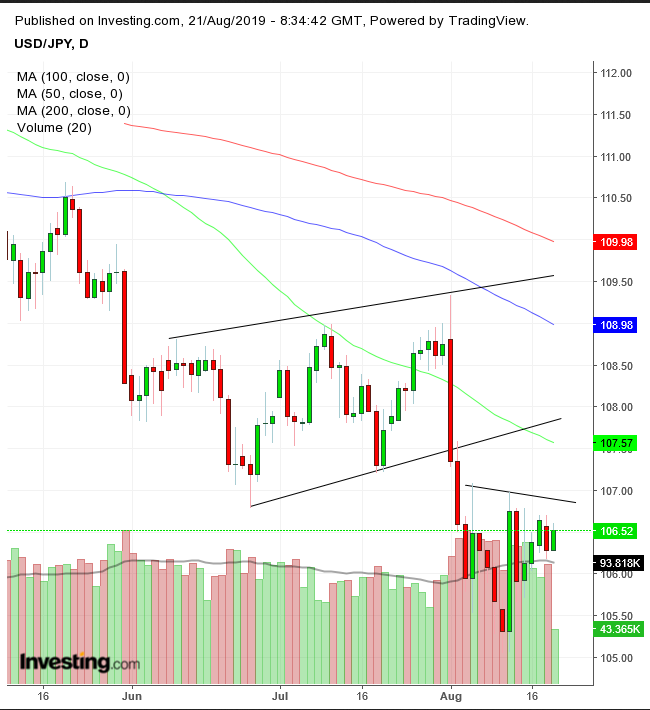
While the Dollar Index was little changed, the greenback still managed to climb against the yen, potentially forming a small H&S bottom, with volume action supporting such a scenario.
Oil gained ground, though prices remained squeezed between the support of the 200 DMA and the resistance of the falling channel top.
Up Ahead
- Minutes of the Fed’s July meeting, due on Wednesday, will provide details on the discussions leading to the first interest-rate cut in a decade.- Germany will sell 30-year bonds at a 0% coupon for the first time on record on Wednesday, kicking off a flurry of debt sales scheduled for the next two weeks offering negative rates.-Kansas City Federal Reserve Bank hosts its annual central banking symposium in Jackson Hole, Wyoming, starting on Thursday. Fed chair Jerome Powell will give remarks on Friday.- Flash PMIs are out for the euro area on Thursday.- Also on Thursday, the Bank of Indonesia is scheduled to decide oninterest rates, followed by a press conference with Governor Perry Warjiyo.Market Moves
Stocks
- The U.K.’s FTSE 100 rose 0.4%.
- Germany’s DAX climbed 0.4%.
- The MSCI Asia Pacific Index declined 0.3%.
Bonds
- The yield on 10-year Treasurys edged three basis points higher to 1.59%.
- The yield on 2-year Treasurys gained two basis points to 1.53%.
- Britain’s 10-year yield rose two basis points to 0.471%.
- Germany’s 10-year yield climbed two basis points to -0.67%.
Commodities
- The Dollar Index was flat.
- The euro declined 0.1% to $1.1092.
- The British pound slid 0.3% to $1.2139.
- The Japanese yen fell 0.3% to 106.55 per dollar.
- West Texas Intermediate crude gained 0.3% to $56.31 a barrel.
- Gold fell 0.5% to $1,499.48 an ounce.
