- S&P 500's recent correction was normal and potentially a buying opportunity.
- Historical data suggests indexes could deliver positive returns from May to October.
- And, while April may have ended S&P 500's 5-month winning streak, it could actually be a good thing for bulls.
- Want to invest by taking advantage of market opportunities? Don't hesitate to try InvestingPro. Sign up HERE and get almost 40% off for a limited time on your 1-year plan!
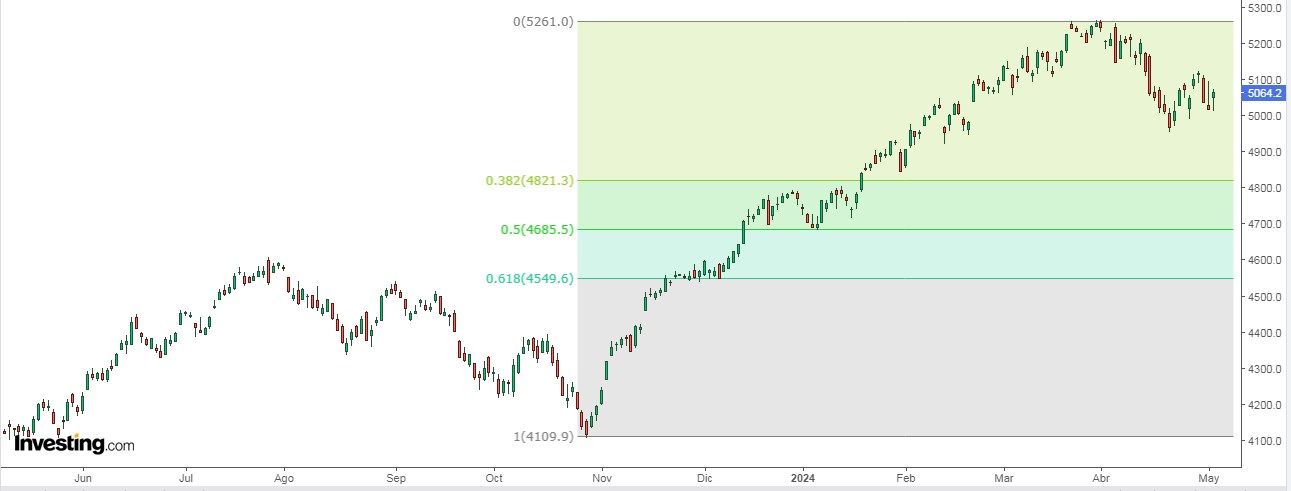
The S&P 500 started a correction after reaching record highs in April. This is a common occurrence - the average annual correction since the 1980s is -14.2%. Even with last year's correction of -10.3%, the S&P 500 still managed an impressive 24% annual gain.
Furthermore, looking at the broader picture, 64% of years since 1928 saw the index experience a drawdown exceeding 10%. This means corrections are a normal part of the market cycle.
When a strong market experiences a correction, it's not unusual to see a pullback towards the first Fibonacci retracement level, which for the S&P 500 sits around 4820. Therefore, a decline to this level is entirely normal and shouldn't be cause for alarm.

So, Is Another Correction Likely Between May to October?
The "sell in May and go away" adage suggests worse stock market performance in the May-October period compared to November-April.
However, this historical pattern seems less relevant in recent times. Over the past 12 years, the S&P 500 has delivered positive returns in 10 of those May-October periods.
Expanding the analysis beyond the S&P 500, we see a similar trend across major global markets. The average return for various indexes during November-April compared to May-October reveals a consistent pattern:
This data reinforces two key points:
- Historically, most major stock markets perform better in the November-April period.
- The "cursed" May-October period has actually delivered positive returns in recent years.
While the "sell in May" adage may hold some historical weight, the data suggests it's less relevant in today's market.
Recent performance indicates that May itself isn't necessarily a bad month for stocks, with the S&P 500 averaging a positive return of 0.14% over the past 50 years and 0.06% over the past 100 years.
The recent correction in the S&P 500 was a normal market occurrence and shouldn't be a cause for panic. While historical patterns like "sell in May" exist, recent data suggests they hold less weight in today's market dynamics.
April Wasn't a Good Month for S&P 500: Is That a Good Thing?
The S&P 500's recent 5-month winning streak may have ended, but history suggests this isn't necessarily bad news. When the S&P 500 experiences a 5-month winning streak, the following 3, 6, and even 12 months often see positive returns.
Looking at the past 7 occurrences, the average returns after such a streak were:
- 1 Month Later: -0.1%
- 3 Months Later: +3.3%
- 6 Months Later: +7.6%
- 12 Months Later: +12.4%
Expanding the timeframe to the last 50 years, the average returns become:
- 1 Month Later: +0.7%
- 3 Months Later: +2.2%
- 6 Months Later: +4.4%
- 12 Months Later: +9.6%
While past performance doesn't guarantee future results, these historical trends offer a positive outlook for the S&P 500 in the coming months.
Weight-Loss Drug Stocks Are on the Rise: Should You Buy in?
Weight-loss drugs are surging in popularity, driving up the stock prices of companies like Eli Lilly and Novo Nordisk (CSE:NOVOb). But they're not the only players in this booming market.
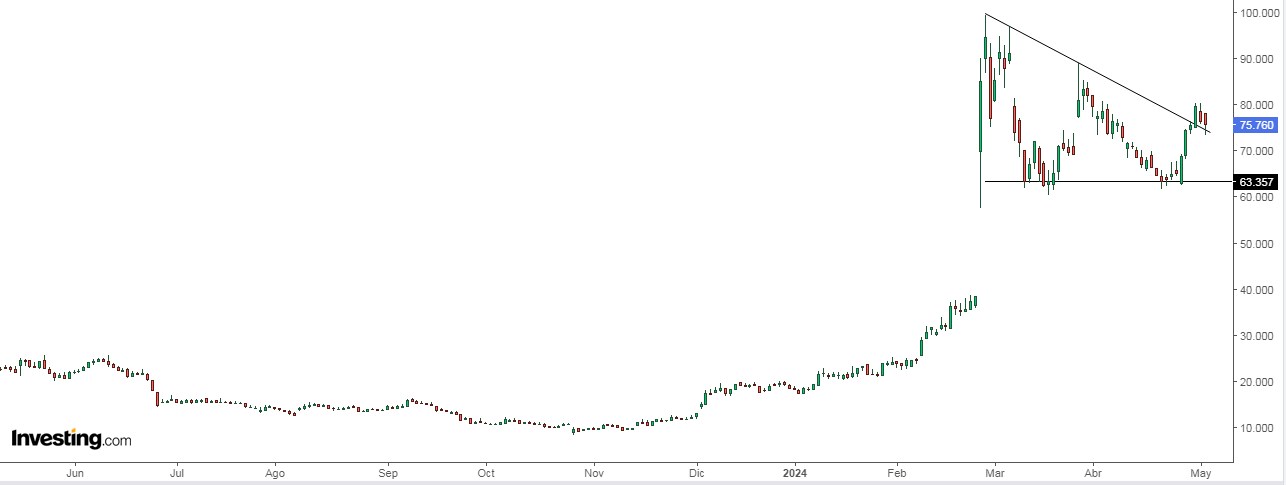
Viking Therapeutics (NASDAQ:VKTX), for instance, has skyrocketed 314% this year, fueled by hopes that its drug could outperform rivals. Plus, with a market cap of just $6.9 billion, it's a potential acquisition target.

Investors seeking a broader exposure to this trend can turn to the Tema Obesity & Cardiometabolic ETF (NASDAQ:HRTS).
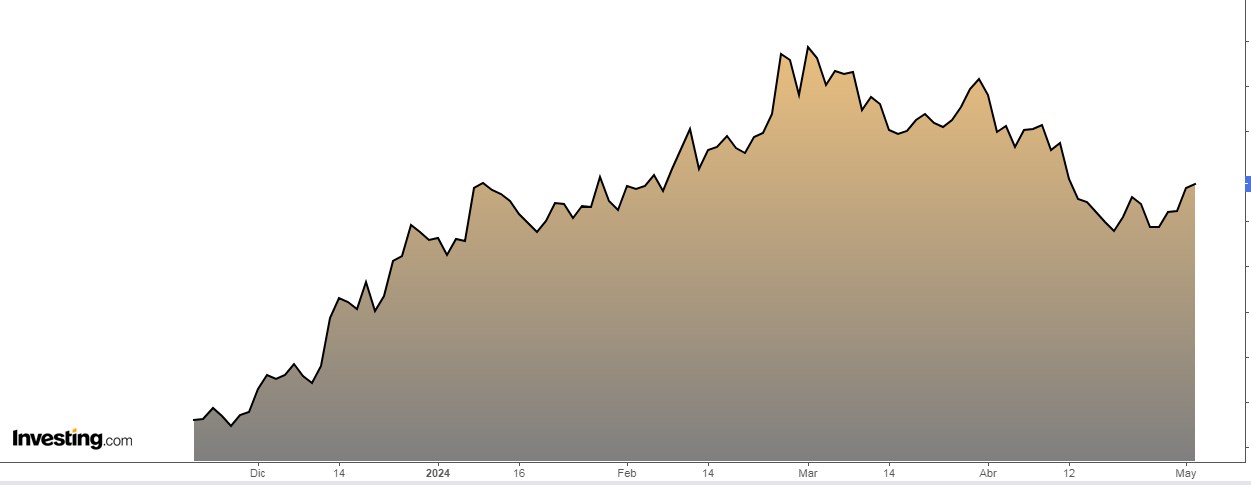
Launched in November 2023, this ETF actively manages a portfolio of 40 stocks across the weight-loss and cardiometabolic space. With $52 million in assets and a 0.75% annual fee, it has gained 12% in the past 3 months.

Here are some of its top holdings:
- Vertex Pharmaceuticals (NASDAQ:VRTX) (5.24%)
- Eli Lilly and Company (NYSE:LLY) (5.03%)
- Novo Nordisk (NYSE:NVO) (4.91%)
- Amgen (NASDAQ:AMGN) (4.57%)
- DexCom (NASDAQ:DXCM) (4.07%)
Investor Sentiment
Bullish sentiment, i.e. expectations that stock prices will rise over the next six months, rebounded 6.4 points to 38.5% and remains above its historical average of 37.5%.
Bearish sentiment, i.e., expectations that stock prices will fall over the next six months, declined 1.4 points to 32.5%.
***
Want to invest successfully? Take the opportunity HERE AND NOW to get the InvestingPro plan that best suits your needs. Use the code INVESTINGPRO1 and get almost 40% off your 1-year subscription - less than what a Netflix subscription costs you! (And you get more out of your investments too). With it, you'll get:
- ProPicks: AI-managed portfolios of stocks with proven performance.
- ProTips: digestible information to simplify a lot of complex financial data into a few words.
- Advanced Stock Finder: Search for the best stocks based on your expectations, taking into account hundreds of financial metrics.
- Historical financial data for thousands of stocks: So that fundamental analysis professionals can delve into all the details themselves.
- And many other services, not to mention those we plan to add soon.
Act fast and join the investment revolution - get your OFFER HERE!
Disclaimer:This article is written for informational purposes only; it does not constitute a solicitation, offer, advice, or recommendation to invest as such it is not intended to incentivize the purchase of assets in any way. I would like to remind you that any type of asset, is evaluated from multiple points of view and is highly risky and therefore, any investment decision and the associated risk remains with the investor.

