
The S&P 500 closed to record highs, yet with resistance nearby it's touch and go as to whether it can hold above key support.
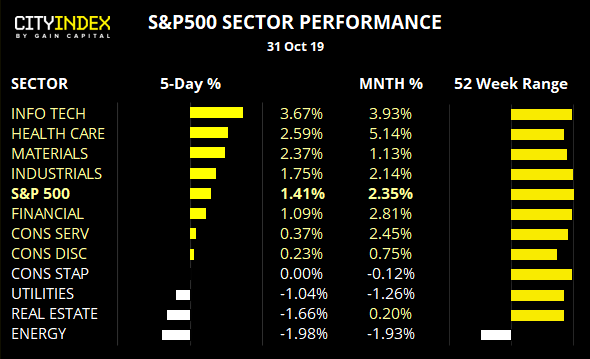
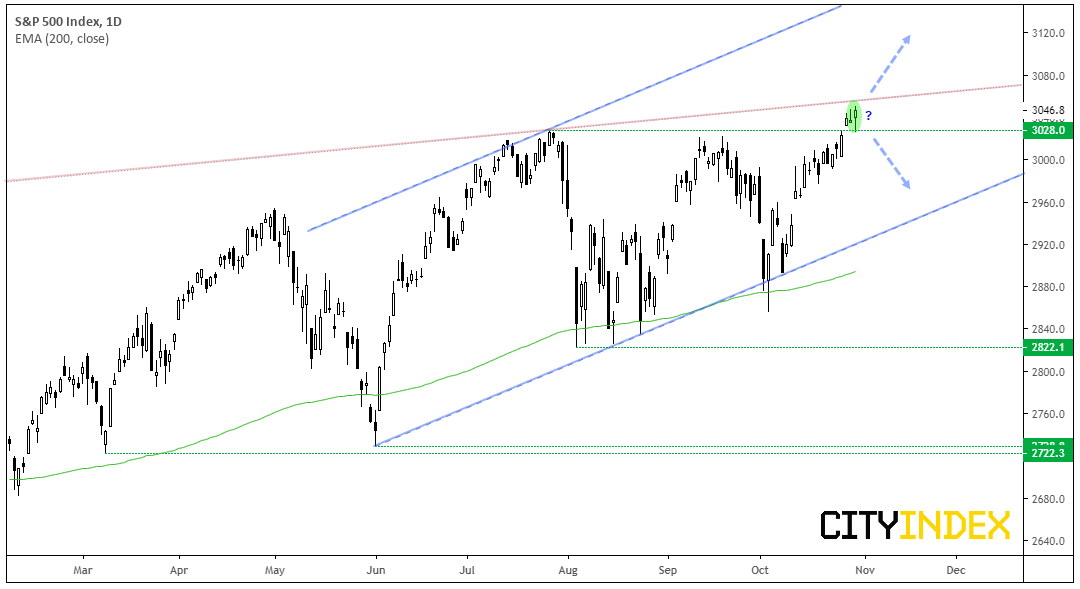
The S&P 500 closed to new highs following yesterday’s Fed meeting, supported by higher earnings while also taking comfort from Powell’s comments that a hike is unlikely. Technically, it rests on the pivotal level of 3028, yet resistance nearby awaits. A break above the January 2018 resistance level assume bullish trend continuation, whereas a break back beneath 3028 warns of a bull-trap and deeper correction.
Flicking through equities for the S&P 500 showed greater potential for short setups than longs. Perhaps that’s a bad omen for new highs on S&P 500, although part of the reason many longs were rejected were because they were either too close to earnings or overextended without any signs of a pullback.
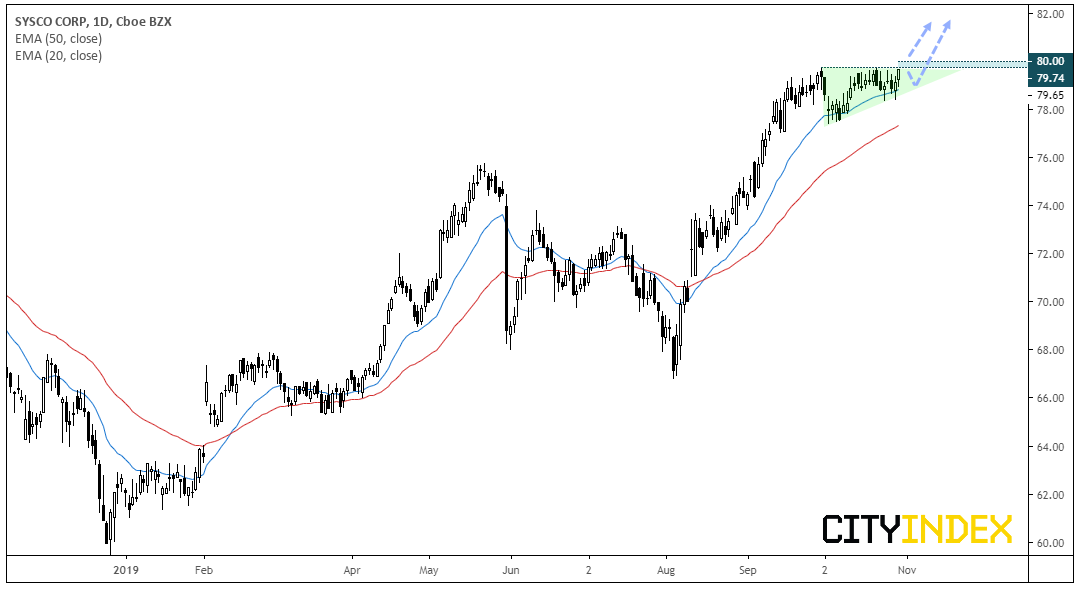
Sysco Corp (NYSE:SYY) CFD/DFT: Trading just off its all-time highs, prices have had a chance to consolidate below 80 which has provided adequate mean reversion for a potential long setup. The recent higher low has respected the 20-day average and it appears that prices could just as easily break higher as it could produce another higher low to form a potential ascending triangle.
Keep I mind that earnings are on Nov. 4, where a notable earnings miss could topple this from its highs. Hopefully though, they’ll be supportive of this compelling setup.
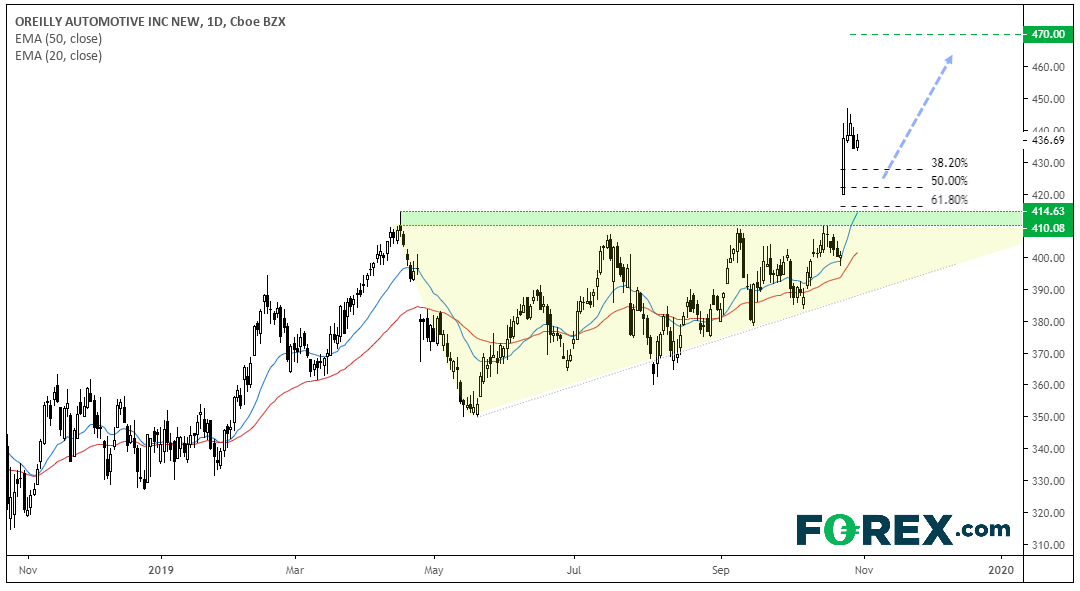
O'Reilly Automotive Inc CFD/DFT: Positive earnings saw this explode higher out of an ascending triangle and found resistance around the monthly R3 pivot (not pictured for a cleaner chart). A hammer at the highs showed prices were exhausted and now a retracement is underway. This may be a little premature for the watchlist, but it’s worthy keeping an eye on none the less given the strength of the breakout.
With little in the way of support above 410-415, traders can see if prices stabilize around a Fibonacci level. If satisfied a higher low has formed, a volatility such as ATR can be used to calculate the ‘invalidation point’ of the bullish bias. Bullish swing traders could then look to enter, or for a more conservative approach, wait for signs bullish momentum has returned to provide greater confidence the low is in.
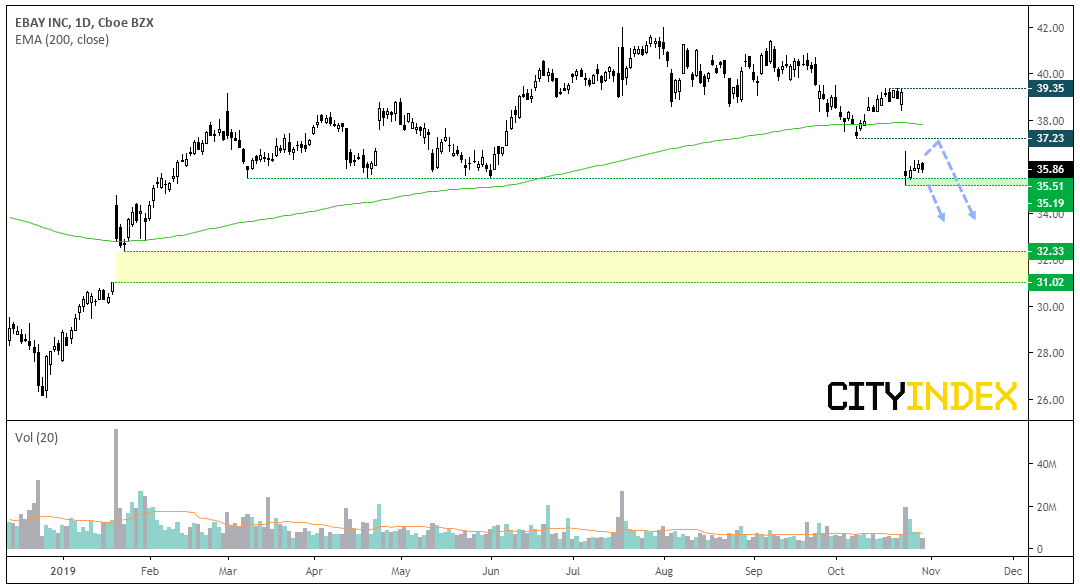
eBay (NASDAQ:EBAY) CFD/DFT: Long known for its discounts, eBay’s stock price also found itself on sale following poor earnings last week. Thursday’s large gap lower saw it plummet through the 200-day eMA and now prices are clinging onto key support around $35. The fact it has failed to provide any meaningful rally despite the S&P500 hitting new highs is telling, as is the declining volume during this week’s lacklustre ‘rebound’.
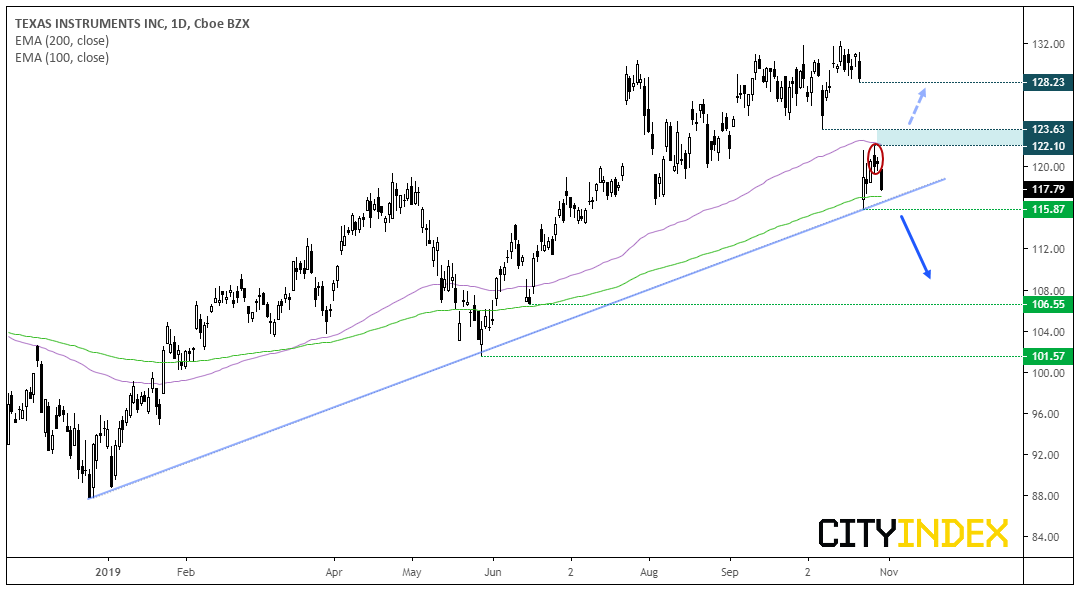
Texas Instruments (NASDAQ:TXN) CFD/DFT: The gap lower last week took prices straight down to the bullish trendline and 200-day eMA. So, we’re at another juncture where bulls either save the day and keep prices above these levels, or the dead cat has bounced and we’re waiting for a break lower.
Given the magnitude of the gap from its highs (a breakaway gap) and that the pullback from the trendline has found resistance below the 100-day average, the bias is for a break lower.