BoC Holds:
The Bank of Canada held interest rates steady at 0.5% last night. After cutting rates twice in 2015 and huge uncertainties around commodity prices and sagging economic growth off the back of them, this decision polarised both economist opinion and markets themselves.
“All things considered, therefore, the risks to the profile for inflation are roughly balanced. Meanwhile, financial vulnerabilities continue to edge higher, as expected. The Bank’s Governing Council judges that the current stance of monetary policy is appropriate, and the target for the overnight rate remains at 1/2 percent.”
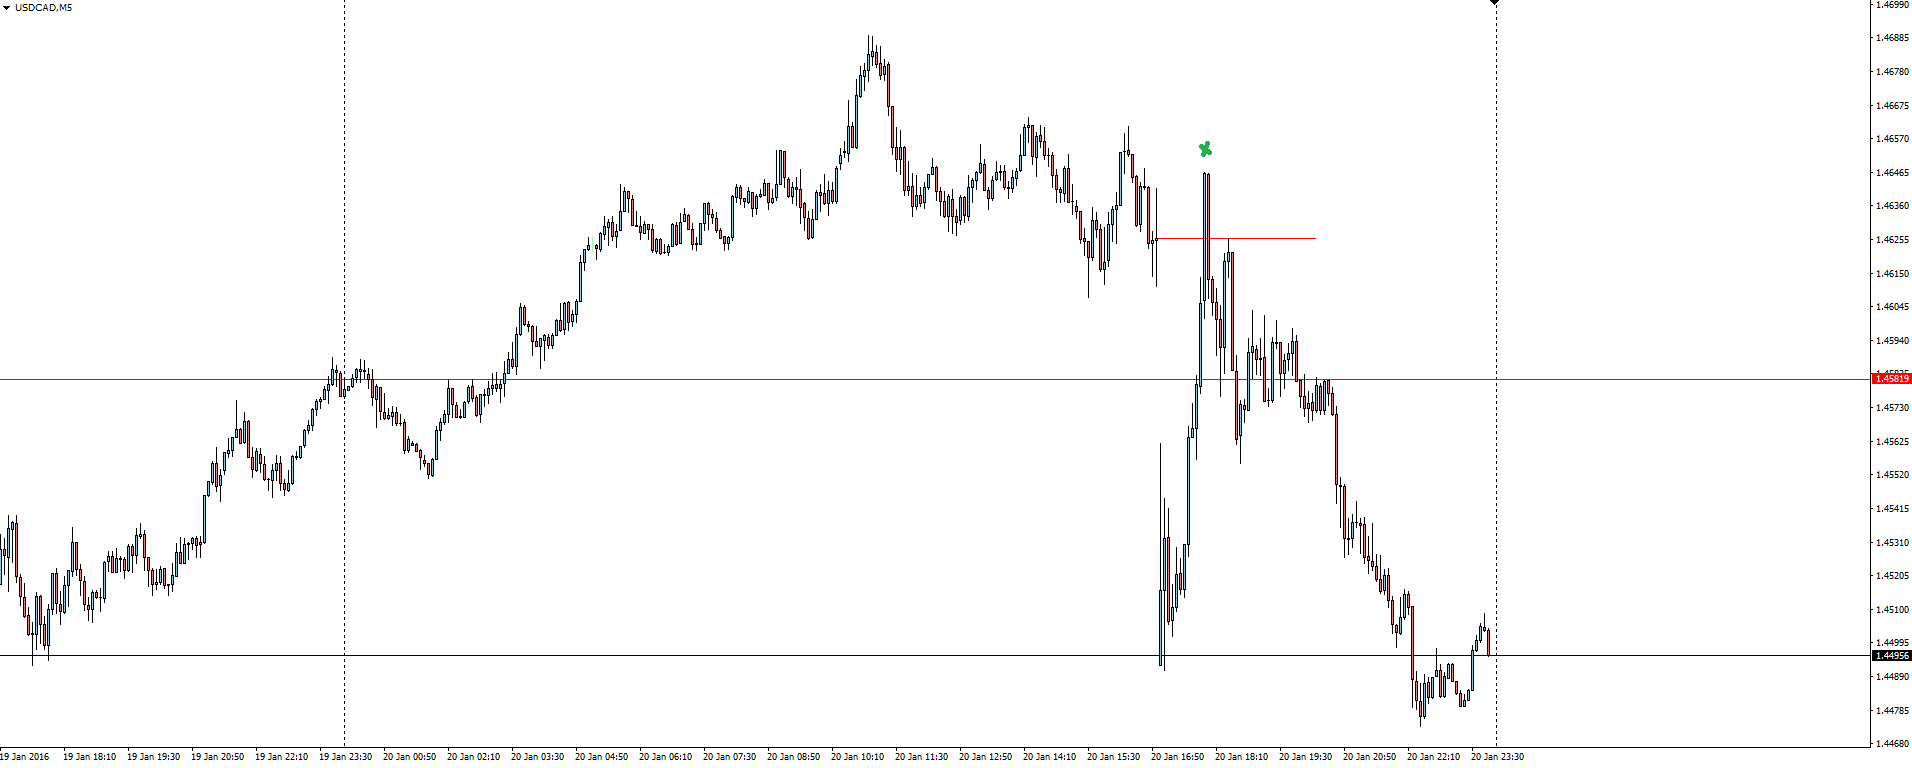
Taking a look at the 5 minute USD/CAD chart over the decision, the immediate drop shows that markets had overly priced in another rate cut.
The gap was subsequently filled, but the confident tone in the accompanying statement from the ‘Banque Du Canada‘ saw the CAD end the day well on top.
With new Canadian Prime Minister, Justin Trudeau expected to unleash massive fiscal spending, the BoC was happy to take the conservative route.
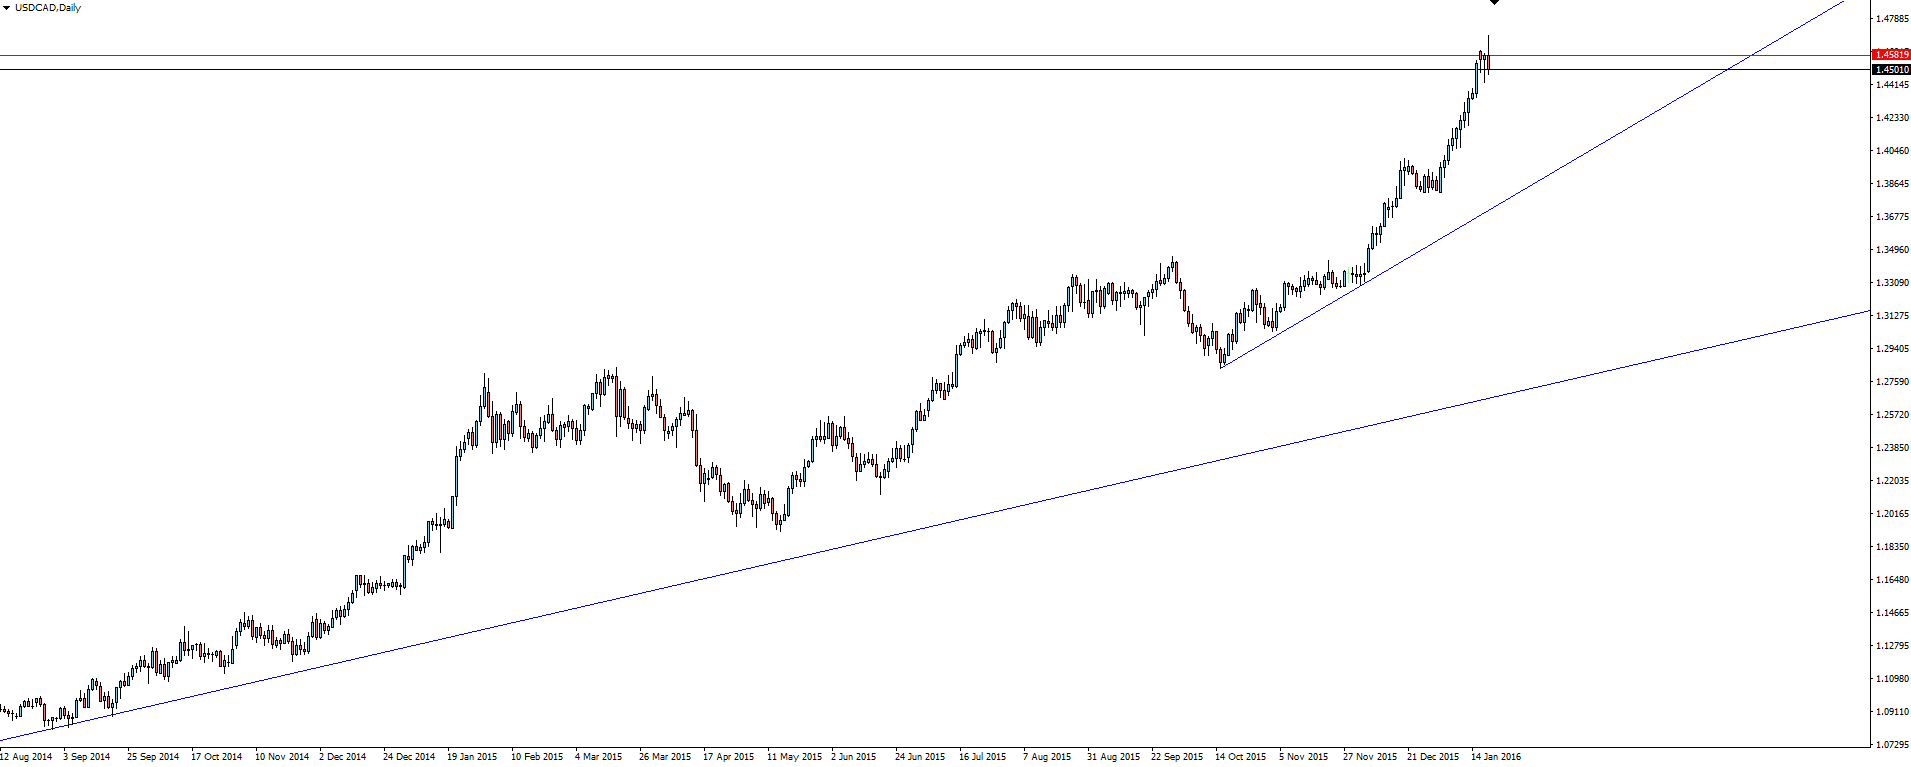
USD/CAD Daily:
Who’s willing to put their hand up first that they’re looking for a return to the mean on the USD/CAD daily chart?
Stocks on the Brink:
Overnight we saw the S&P 500 index fall 1.2%, to close at its lowest level since April 2014…
Let me share some of my favourite lines from morning notes that pass my desk in relation to the US stock market overnight:
“Traders saw capitulation day.”
“This was the flush out in equities.”
“What you saw here was an oversold market.”
Look at the charts in the section below and then you tell me if you agree with any of that?
Chart of the Day:
In the Technical Analysis section on Tuesday, we took a look at major trend line support across Indices. With the expectation that the US market will somewhat lead the rest, we feature last night’s S&P 500 price action in today’s chart of the day.
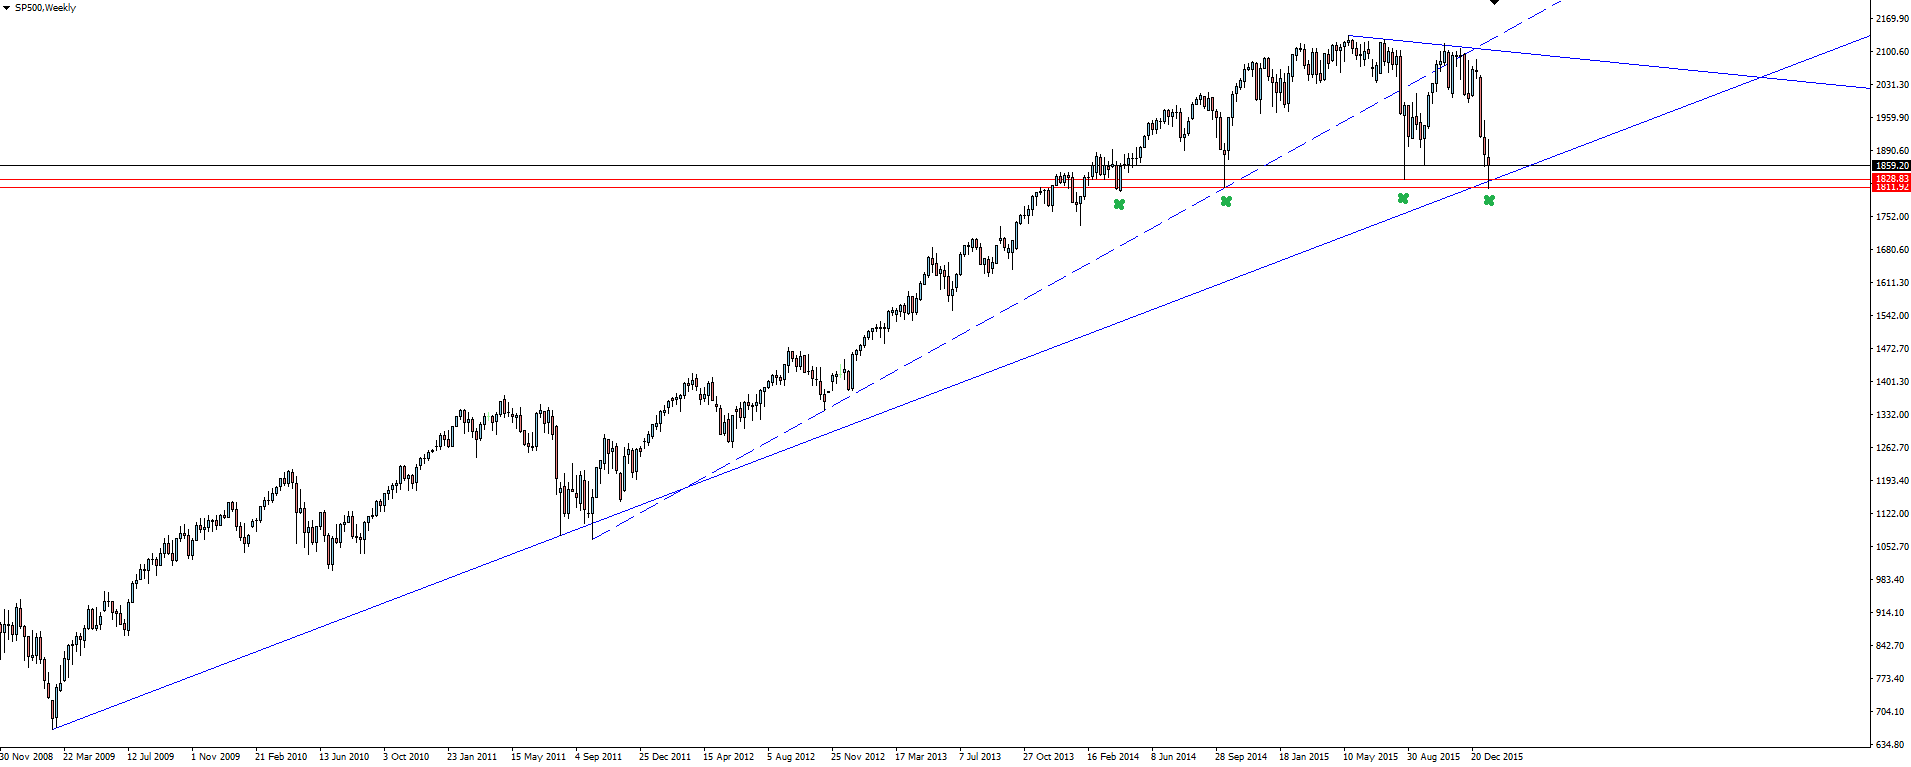
S&P 500 Weekly:
It’s a little funny saying this after only 2 days of price action, but the weekly chart gives the clearest picture of last night’s lunge down in stocks. But look at where the selling was halted.
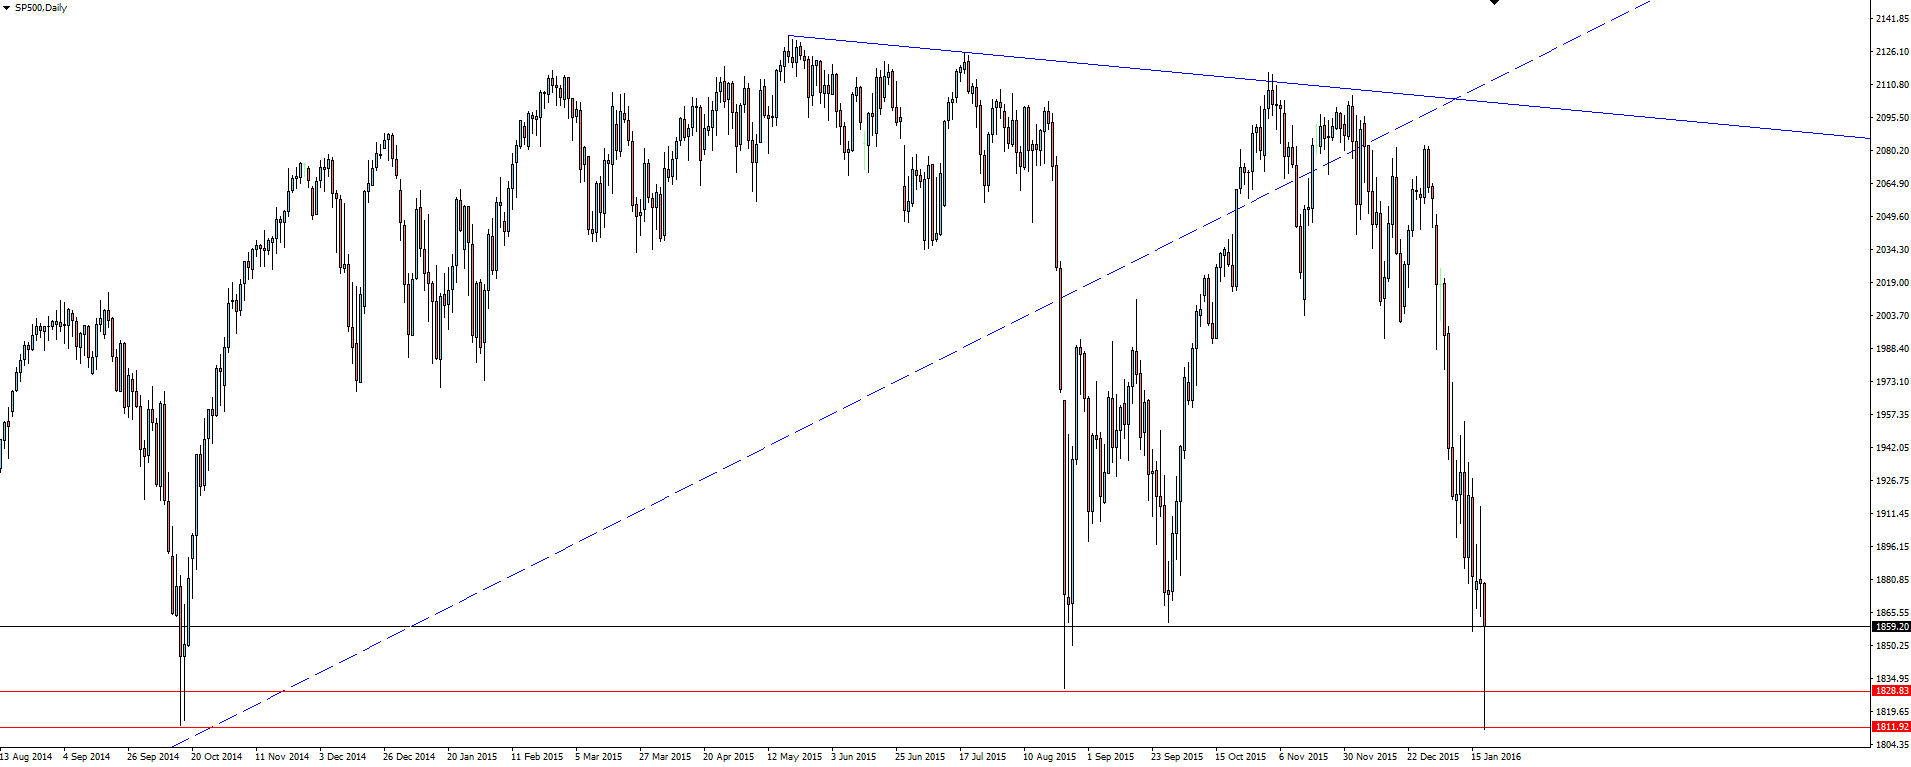
Zooming into the daily and the start of 2016 has just been vertical… Look at the way that the above marked zone soaks up the sellers and has bounced hard each time. How many touches on a level like this is too many touches?
Once this major trend line goes, the similar line across all of the Indices we have been watching will go with it and things are going to get messy.
‘Capitulation Day’ will make a nice headline one day soon, but last night wasn’t it.
On the Calendar Thursday:
AUD MI Inflation Expectations
EUR Minimum Bid Rate
USD Philly Fed Manufacturing Index
USD Unemployment Claims
USD Crude Oil Inventories
Risk Disclosure: In addition to the website disclaimer below, the material on this page prepared by secure Forex Broker Vantage FX Pty Ltd does not contain a record of our prices or solicitation to trade. All opinions, news, research, tools, prices or other information is provided as general market commentary and marketing communication – not as investment advice. Consequently any person acting on it does so entirely at their own risk. The experts writers express their personal opinions and will not assume any responsibility whatsoever for the actions of the reader. We always aim for maximum accuracy and timeliness, and trusted Forex broker Vantage FX shall not be liable for any loss or damage, consequential or otherwise, which may arise from the use or reliance on this service and its content, inaccurate information or typos. No representation is being made that any results discussed within the report will be achieved, and past performance is not indicative of future performance.


