By Amruta Khandekar and Shristi Achar A
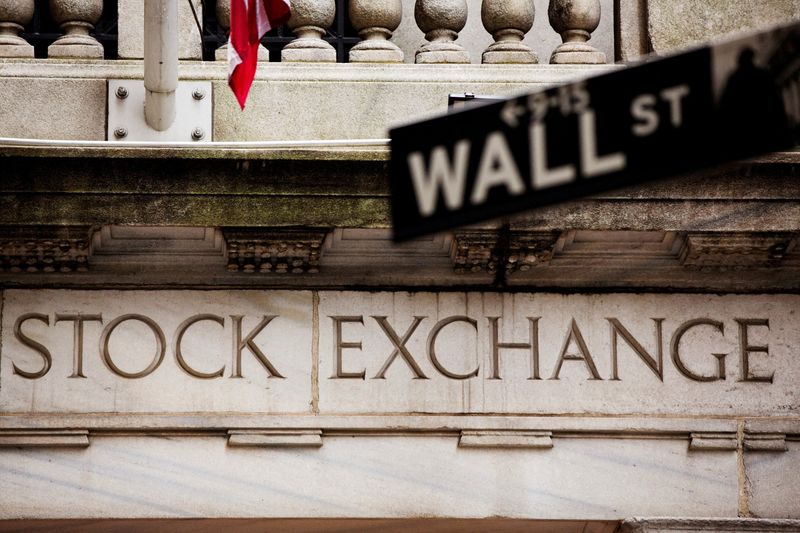
(Reuters) - Wall Street's main indexes slipped on Friday after a jobs report pointing to a resilient U.S. labor market dampened hopes that the Federal Reserve would cut interest rates by early next year, while gains in energy shares helped limit declines.
The Labor Department's report showed nonfarm payrolls increased by 199,000 jobs in November, compared with an estimated increase of 180,000.
The unemployment rate slipped to 3.7%, against expectations that it would remain steady at 3.9%, while average earnings rose 0.4% on a monthly basis, compared with forecasts of 0.3% growth.
Bets that the Fed will deliver a rate cut in March eased to 46.7% after the report from 57.7%, according to the CME Group's (NASDAQ:CME) FedWatch tool.
"There's been increasing pressure around the Fed to pivot to a more accommodative message, and these numbers are going to give the Fed cover to continue that very hawkish approach," said Tony Roth, chief investment officer at Wilmington Trust in Philadelphia.
"The market has been priced for perfection in terms of that soft landing. (But) that is (not) going to happen in a direct line, it is going to be bumpy."
The payrolls report is in contrast to a slew of data this week that indicated a softening labor market and fueled bets that the central bank was at the end of its tightening campaign and could pivot to lower rates soon.
The tech-heavy Nasdaq underperformed peers as Alphabet (NASDAQ:GOOGL) slipped 1.7% after an artificial intelligence-driven rally in the prior session.
Other megacap stocks were mixed, with Nvidia up 1.1%.
Six of the 11 S&P 500 sector indexes traded in the red. Energy stocks limited declines, rising 1% as crude prices gained. [O/R]
Optimism around peak interest rates and upbeat quarterly earnings led to a strong rebound in equities towards the end of the year, while the 10-year Treasury yield has plunged from its October peak of about 5%.
The S&P 500 has risen 19% so far in 2023 and is within close range of its highest intraday level of the year hit in July.
At 9:38 a.m. ET, the Dow Jones Industrial Average was down 19.42 points, or 0.05%, at 36,097.96, the S&P 500 was down 6.04 points, or 0.13%, at 4,579.55, and the Nasdaq Composite was down 48.60 points, or 0.34%, at 14,291.39.
Honeywell (NASDAQ:HON) dipped 1.9% after the industrial firm said it would buy air conditioner maker Carrier Global's security business for $4.95 billion. Carrier's shares rose 5.5%.

Declining issues outnumbered advancers for a 1.08-to-1 ratio on the NYSE and for a 1.02-to-1 ratio on the Nasdaq.
The S&P index recorded 10 new 52-week highs and no new lows, while the Nasdaq recorded 29 new highs and 25 new lows.